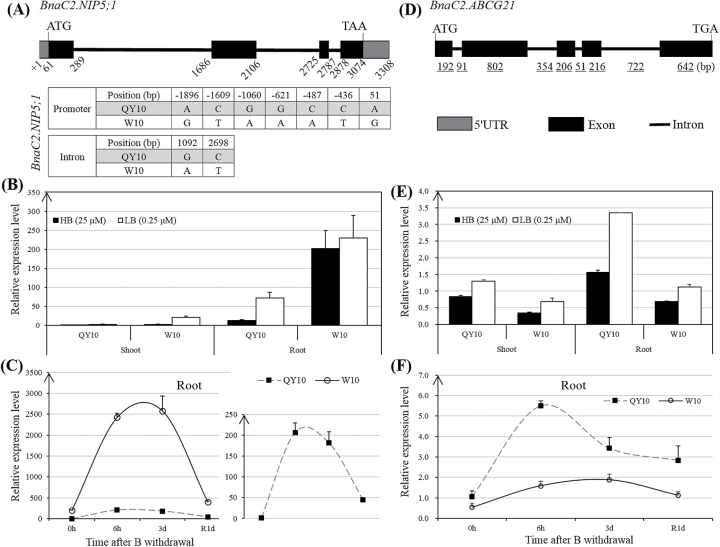
Fig. 10.
Gene structures and validation of BnaC2.NIP5;1 and BnaC2.ABCG21 expression levels by RT-qPCR. (A) Gene structures and allelic variations of BnaC2.NIP5;1 between the B-efficient genotype ‘QY10’ and the B-inefficient genotype ‘W10’. The DNA polymorphisms of BnaC2.NIP5;1 between ‘QY10’ and ‘W10’ were identified by whole-genome re-sequencing (WGS), and the transcription start site was defined by ‘+1’. (B, C) Validation of BnaC2.NIP5;1 expression levels in the roots under long-term (B) and short-term (C) B deficiency conditions. (D) Gene structure of BnaC2.ABCG21; (E-F) validation of BnaC2.ABCG21 expression levels in the roots under long-term (E) and short-term (F) B deficiency conditions. HB/LB, high (25 μM)/low (0.25 μM) B; R1d, B resupply for 1 d. Long-term B deficiency conditions: B. napus seedlings were cultivated for 20 d under 0.25 μM B conditions. Short-term B deficiency conditions: B. napus seedlings were cultivated for 10 d under 10 μM B and were then transferred to a solution without B supply. Data presented are the means (n=3), and error bars denote the standard deviations.

