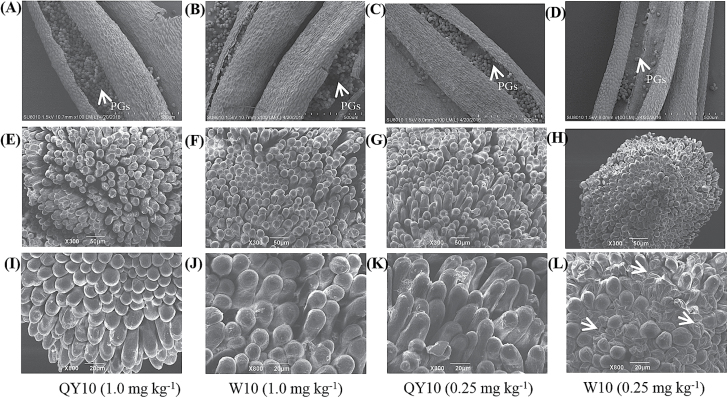
Fig. 5.
Scanning electron microscopy (SEM) analysis of anthers and stigmas of the B-efficient genotype ‘QY10’ and the B-inefficient genotype ‘W10’, which were grown under high (1.0 mg per kg soil) and low (0.25 mg per kg soil) B conditions in a pot culture system. (A–D) Overview of the anthers of ‘QY10’ and ‘W10’. Pollen grains (PGs) are indicated by arrows. (E–H) Low-magnification view of the stigma morphologies of ‘QY10’ and ‘W10’; (I–L) close-up view of the stigma morphologies of ‘QY10’ and ‘W10’. (L) The over-crowded, collapsed, and shrivelled mastoids on the top of the stigmas of ‘W10’ under B deficiency are indicated by arrows.

