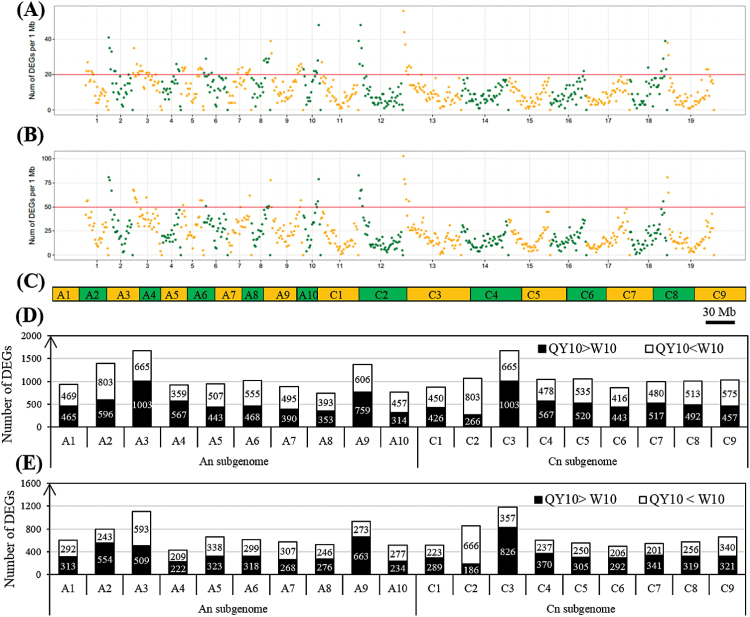
Fig. 7.
Distribution and number of genome-wide differentially expressed genes (DEGs) between the B-efficient genotype ‘QY10’ and the B-inefficient genotype ‘W10’. (A, B) Distribution of the DEGs in the shoots (A) and roots (B). The x-axis represents the chromosome size (Mb) while the y-axis represents the number of SNPs or InDels at that point on each chromosome; (C) graph delineating the B. napus chromosome sizes; (D, E) number of DEGs in the shoots (D) and roots (E). ‘QY10 > W10’ indicates that the transcript levels of DEGs are higher in ‘QY10’ than in ‘W10’, and vice versa. (This figure is available in colour at JXB online.)

