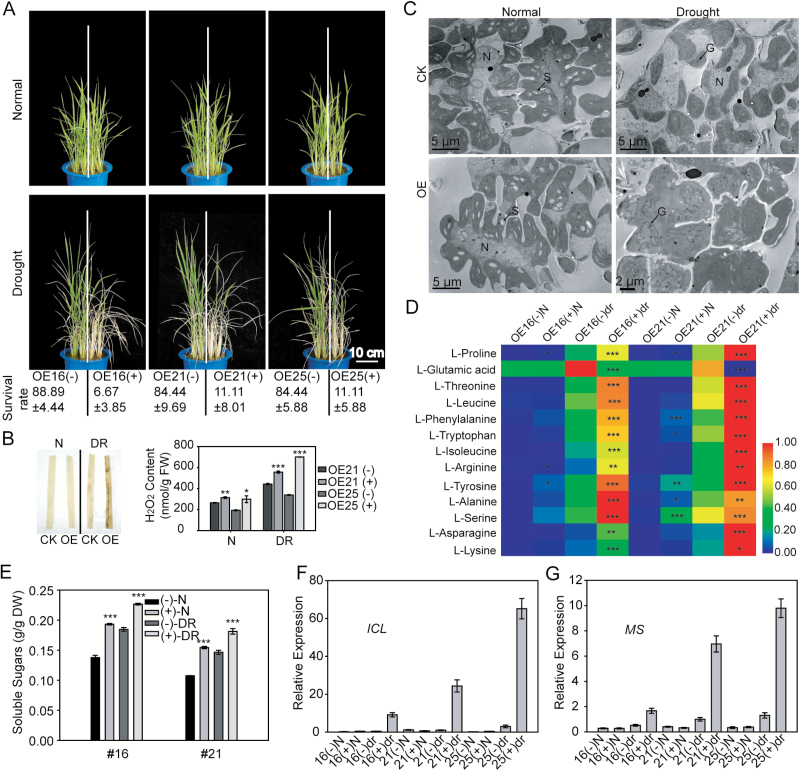
Fig. 2.
Overexpression of Ghd2 accelerated drought-induced leaf senescence at the seedling stage. (A) Phenotypes of the Ghd2-OE and WT' plants under drought stress treatment. Survival rates are shown below. Data represent the mean ± SE based on three replicates. Images presented above show five seedlings grown in one-half of each pot, whereas 15 seedlings grown in one-half of each pot were used for determining the survival rate. ‘+’ and ‘-’ refers to segregated transgenic and non-transgenic plants, respectively, from the Ghd2-OE lines. (B) H2O2 content in the Ghd2-OE and WT' plant leaves under normal and drought stress conditions. Left, DAB staining; right, H2O2 quantification. CK, the non-transgenic control (WT'). N, normal; DR, drought treatment; FW, fresh weight. Data represent the mean ± SE (n = 3). *P < 0.05, t-test; **P < 0.01, t-test; ***P < 0.005, t-test. (C) TEM images of the ultrastructure of Ghd2-OE and WT' plant leaves under normal and drought stress conditions. G, grana stack; N, nucleus; S, starch granule. (D) Contents of free amino acids in Ghd2-OE and WT’ plants at the seedling stage under normal and drought stress conditions. The data were analysed using the Heatmap Illustrator (http://hemi.biocuckoo.org/down.php). The data represent the mean ± SE (n = 3). *P < 0.05, t-test; **P < 0.01, t-test; ***P < 0.005, t-test. (E) Contents of soluble sugars in the Ghd2-OE and WT' plants. DW, dry weight. ***P < 0.005, t-test. (F and G) Validation of the expression changes of ICL (F) and MS (G) in a microarray analysis using qRT-PCR.

