Fig. 3.
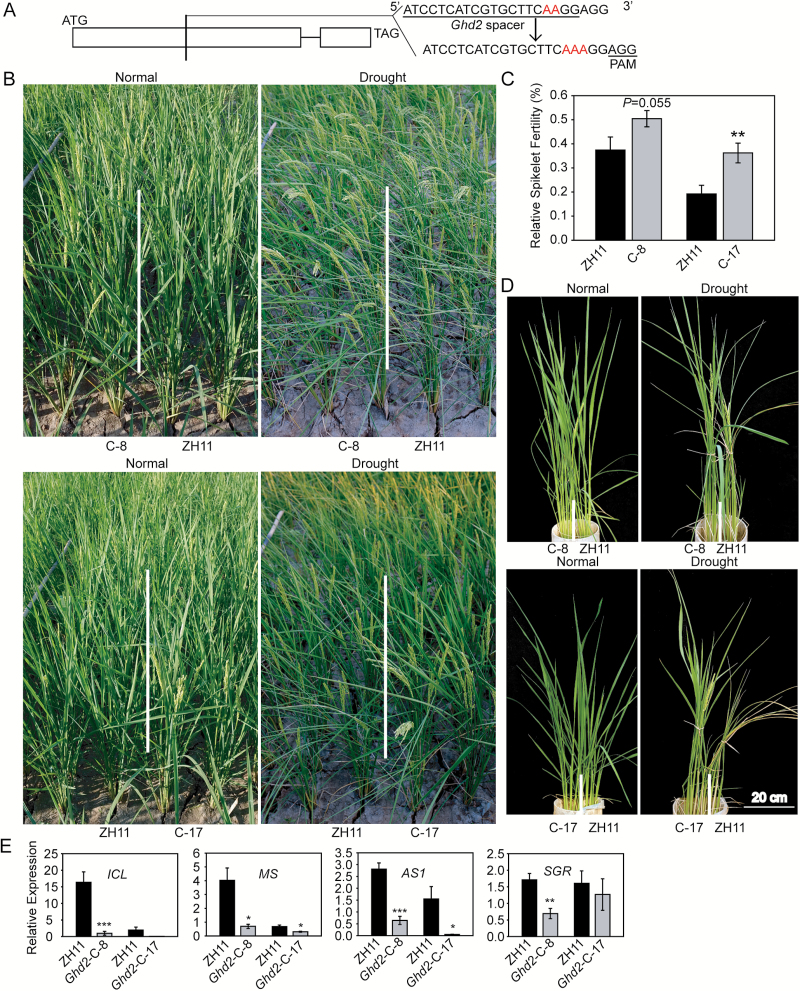
Ghd2-CRISPR plants showed delayed drought-induced leaf senescence. (A) Diagram showing the structure of Ghd2 for CRISPR. (B) Phenotypes of the Ghd2-CRISPR (C-x) and WT (ZH11) plants during drought stress treatment in the field facilitated with a moveable rain-off shelter. (C) Relative spikelet fertility of the Ghd2-CRISPR and WT plants after moderate drought stress treatment at the panicle development stage in the field. Data represent the mean ± SE (n = 12). **P < 0.01, t-test. (D) Phenotypes of the Ghd2-CRISPR and WT plants during severe drought stress treatment at the reproductive stage in PVC pots. (E) Real-time qRT-PCR results showing the expression levels of the SAGs in the Ghd2-CRISPR and WT plants during drought stress treatment. Data represent the mean ± SE (n = 4). *P < 0.05, t-test; **P < 0.01, t-test; ***P < 0.005, t-test.

