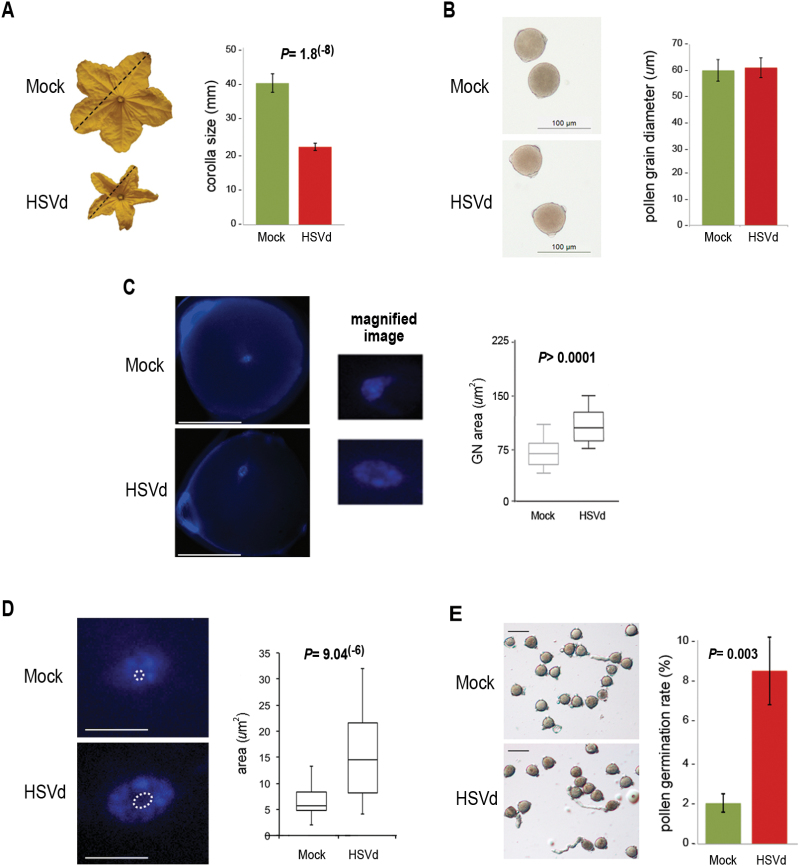
Fig. 1.
Effects of HSVd infection on cucumber reproductive tissues. (A) Male and female flowers obtained from HSVd-infected and mock-inoculated cucumber plants were measured as indicated by the dashed lines shown on the representative images of male flowers. The graph shows mean values of 750 (HSVd-infected) and 650 (control) flowers. Statistical significance was tested using a paired t-test. (B) Micrographs of representative pollen grains recovered from HSVd-infected and mock-inoculated cucumber plants. The graph shows the mean diameter of 200 pollen grains recovered from infected and control plants. No significant differences were observed (paired t-test). (C) Representative images of DAPI-stained pollen grains from non-infected and HSVd-infected plants and magnifications of the respective generative nuclei (GN) of the cells. Scale bars = 30 µm. The box-plots show the distribution of the measured areas of the GN of more than 100 pollen grains. Statistical significance was tested using a paired t-test with Welch’s correction. (D) Representative images of DAPI-stained generative nuclei of cells. The area corresponding to the nucleolus is highlighted. Scale bars = 150 µm. The box-plots show the distribution of the measured areas of the nucleolus in 32 pollen grains. Statistical significance was tested using a paired t-test. (E) Representative images of germinated pollen grains recovered from mock- and HSVd-infected plants. The graph shows the germination rate of infected pollen grains in comparison with control samples. A total of 1200 pollen grains were analysed for each sample in six independent replicates. Statistical significance was tested using a paired t-test. In all the figure parts the error bars represent the standard error. Only significant P values are shown in the figure. (This figure is available in colour at JXB online.)

