
Figure 1. Interneuron output of the MGE/PoA progenitors in the forebrain; See also Figures S1 and S2.
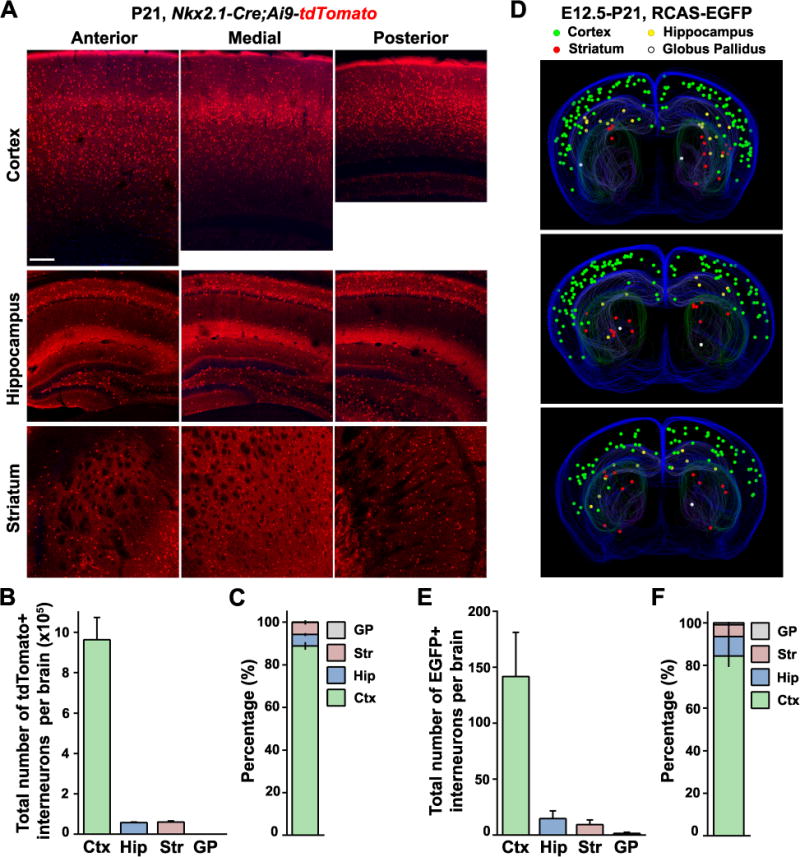
(A) Coronal sections of representative P21 Nkx2.1-Cre/Ai9-tdTomato brains showing tdTomato+ interneuron populations in the cortex (Ctx), hippocampus (Hip), and striatum (Str). Scale bar, 100 μm. (B–C) Quantification of the total number (B) and relative distribution (C) of tdTomato+ interneurons in the Ctx, Hip, Str and globus pallidus (GP). Bars represent mean ± S.D. (n=3 brains). (D) Three-dimensional stereological reconstructions of representative P21 brains that received intraventricular injection of low-titer RCAS retrovirus expressing EGFP at E12.5. Green, yellow, red, and white dots represent EGFP-labeled interneurons in the Ctx, Hip, Str, and GP, respectively. (E–F) Quantification of the total number (E) and relative distribution (F) of EGFP+ interneurons in the Ctx, Hip, Str, and GP labeled using in-utero intraventricular RCAS-EGFP injection at E12.5. Data are presented as mean ± SD (n=7 brains).