
Figure 2. MGE/PoA-derived interneuron clones in Mayer et al. do not randomly disperse in different forebrain structures, but are mostly located in the cortex or the cortex and hippocampus; See also Figures S2 and S3, and Table S1.
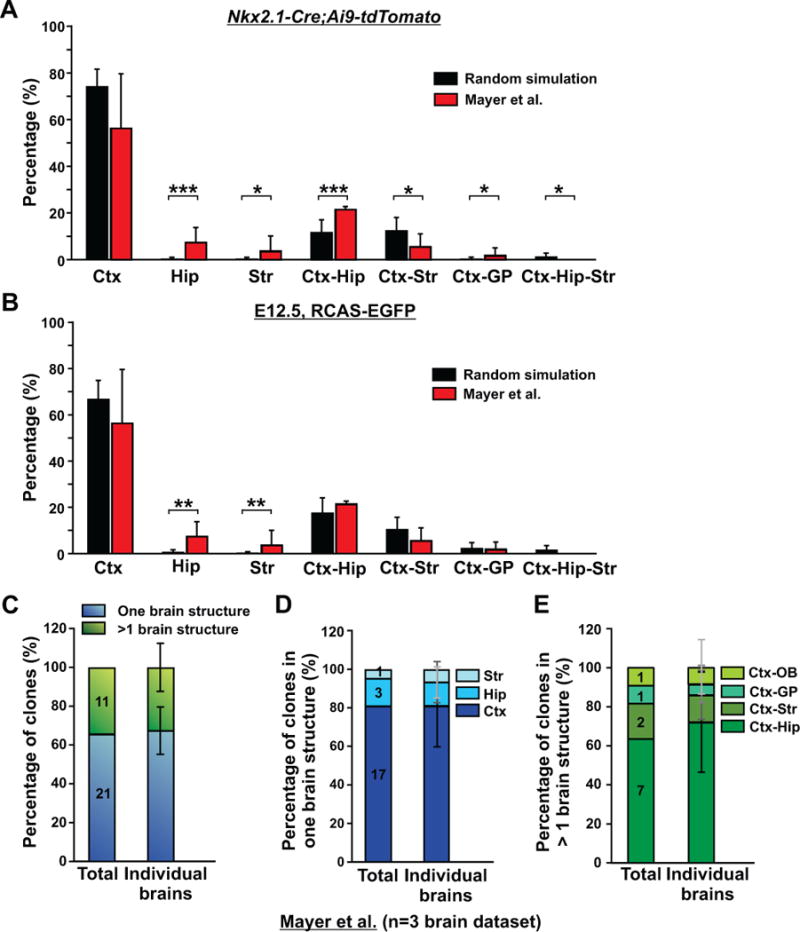
(A) Comparison of the fractions of clones located in the four brain structures (Ctx, Hip, Str, and GP) in the experimental data (red bars) with the predicted probabilities of clone distribution based on a random dispersion and the relative ratio of total MGE/PoA interneuron output to the four structures in P21 Nkx2.1-Cre/Ai9-tdTomato brains (black bars). Data are presented as mean ± S.D. (*, p< 0.05; ***, p<0.001). (B) Comparison of the fractions of clones located in the four brain structures (Ctx, Hip, Str, GP) in the experimental data (red bars) with the predicted probabilities of clone distribution based on a random dispersion and the relative ratio of the interneuron output of E12.5 dividing MGE/PoA VZ progenitor cells to the four structures labeled using in-utero intraventricular RCAS-EGFP injection (black bars). Data are presented as mean ± S.D. (**, p<0.01). (C) Quantification of the percentage of interneuron clones that are restricted to one brain structure (blue) or span more than one brain structure (green). Data are presented as mean ± S.D. (n=3 brains). (D) Quantification of the percentage of interneuron clones restricted to the cortex, hippocampus, or striatum (n=3 brains). (E) Quantification of the percentage of interneuron clones spanning different brain structures (n=3 brains). Ctx, cortex; Hip, hippocampus; Str, striatum; GP, globus pallidus; OB, olfactory bulb.