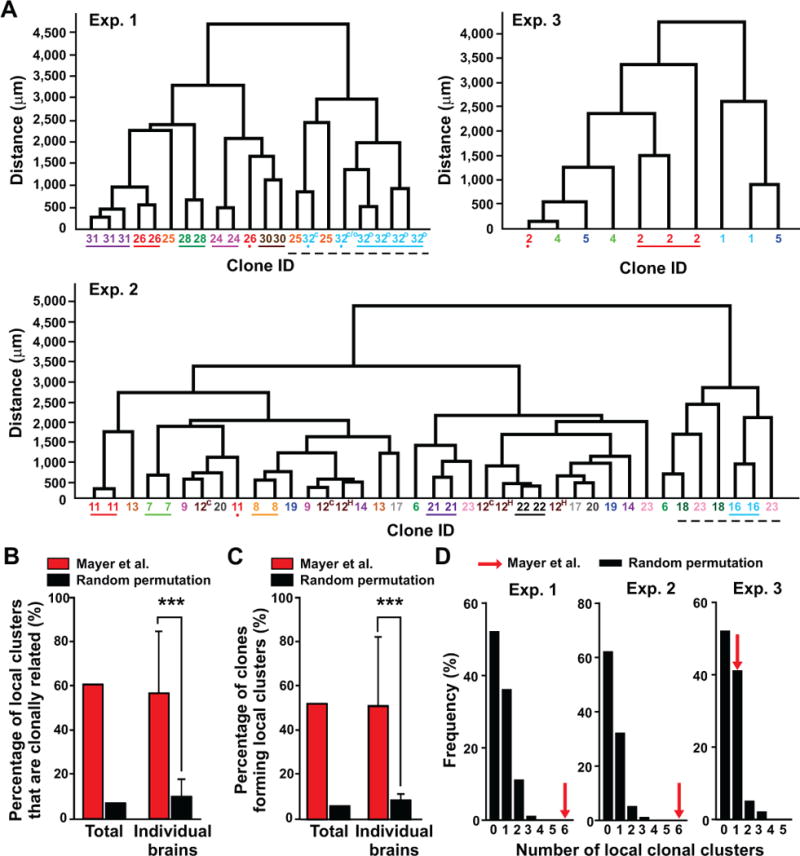
Figure 4. Interneuron clones in Mayer et al. reliably form local clusters; See also Figure S5.

(A) Dendrograms of individual datasets containing multi-cell clones in the same brain structures according to their Euclidean distances. Numbers and colors indicate the lineal relationship between two or more cells based on the recovered barcodes. Colored lines below the numbers indicate spatially isolated clonal clusters. Colored dots mark a sibling neuron located away from the corresponding clonal cluster. Broken black lines indicate local clonal clusters occupying the same or nearby space. The superscript letters indicate the location of the same clone in different brain structures (C, cortex; H, hippocampus; O, olfactory bulb; C/O, cortex or olfactory bulb, uncertain based on the x-y-z spatial coordinates). (B) Quantification of the percentage of local clusters (i.e. the lowest hierarchical branch in the dendrogram) that are clonally related in the experimental dataset (red bars) compared with the percentage estimated from random permutations (i.e. reshuffling) of the clonal identity in the same dendrograms repeated for 100 rounds (black bars). Data are shown as the total percentage in the whole dataset as well as mean ± S.D. (n=3 brains) (***, p<0.001). (C) Quantification of the percentage of clones that form local clusters in the experimental dataset (red bars) compared with the percentage estimated from random permutations of the clonal identity in the same dendrograms repeated for 100 rounds (black bars). Data are shown as the total percentage in the whole dataset as well as mean ± S.D. (n=3 brains) (***, p<0.001). (D) Histograms showing the frequency of local clonal clustering estimated from random permutations of clones. Red arrows indicate the number of local clonal clusters observed in each of the three experimental datasets.
