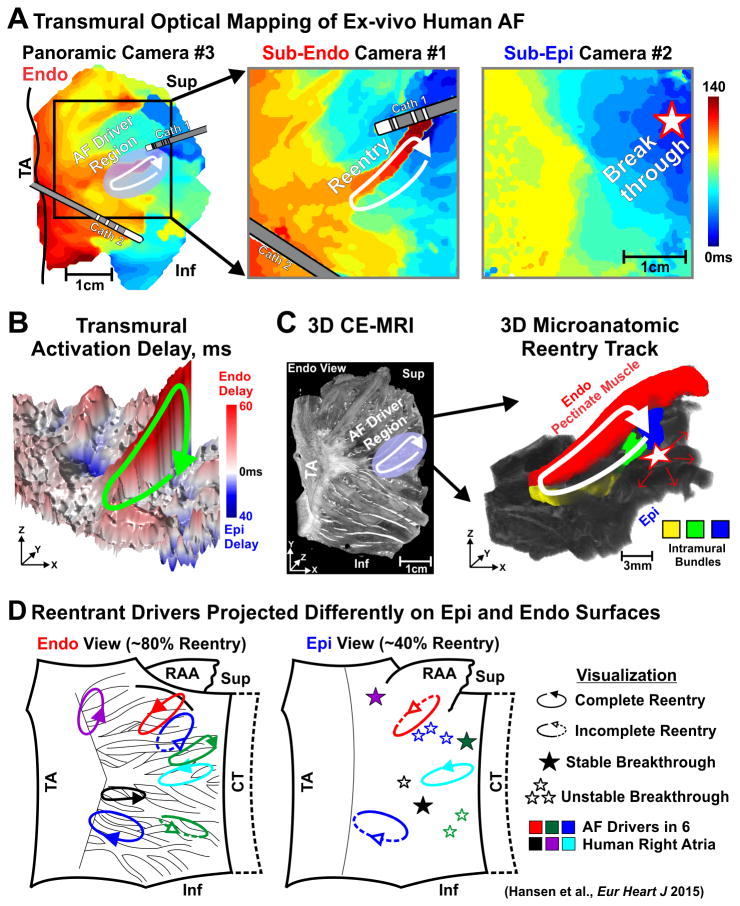
Figure 3.
Microanatomic tracks of reentrant AF drivers resolved by dual-sided optical mapping and CE-MRI. (A) Ex-vivo activation maps from panoramic (left), sub-Endo (middle) and sub-Epi (right) cameras. Pink oval, solid arrow, and star represent the AF driver region, path of reentry, and breakthrough, respectively. (B) Transmural activation delay map with reentrant pathway shown by green arrow. (C) Left: CE-MRI of the LRA showing fibrosis (white) distribution and location of reentrant AF driver (white arrow). Right: 3D view of colored reentry track. (D) Summary of intramural microanatomic reentries visualized from the Endo and Epi. Abbreviations as in Figures 1 and 2; CE-MRI- contrast-enhanced magnetic resonance imaging; CT-crista terminalis; Inf-inferior; LAA-left atrial appendage; RAA-right atrial appendage; Sup-superior; TA-tricuspid annulus. From Hansen et al.1 with permission.

