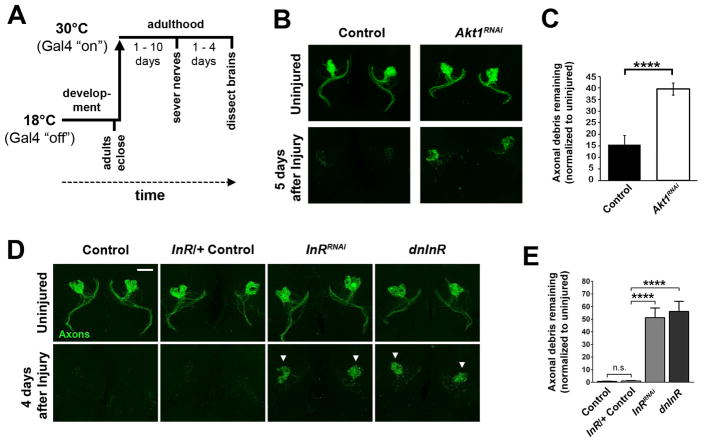
Figure 1. InR/Akt1 is required in adult glia for proper glial clearance of degenerating axons.
(A) Schematic of experimental method to temporally control UAS-driven gene expression. (B) Maximum intensity projections of the antennal lobe region show axons of OR85e ORNs expressing membrane-tethered GFP (green). (C) Quantification of GFP+ axonal material shown in B. N ≥ 18 for each genotype and condition. (D) Confocal projections of OR85e axons in control, InRRNAi or dominant negative InR (dnInR)-expressing flies. White arrowheads point to persistent axonal debris post-injury. (E) Quantification of GFP shown in B. N ≥ 22 for each genotype and condition. ****p < 0.0001. Pooled data plotted as mean ± SEM. All image scale bars represent 20 μm. Genotypes: Control (OR85e-mCD8::GFP, tub-Gal80ts/+; repo-Gal4/+), dnInR (OR85e-mCD8::GFP, tub-Gal80ts/+; repo-Gal4, InRex15/UAS-Dominant Negative InR), InRRNAi (OR85e-mCD8::GFP, tub-Gal80ts/+; repo-Gal4, InRex15/UAS-InRRNAi), AktRNAi (OR85e-mCD8::GFP, tub-Gal80ts/+; repo-Gal4, InRex15/UAS-AktRNAi). See Figure S1.

