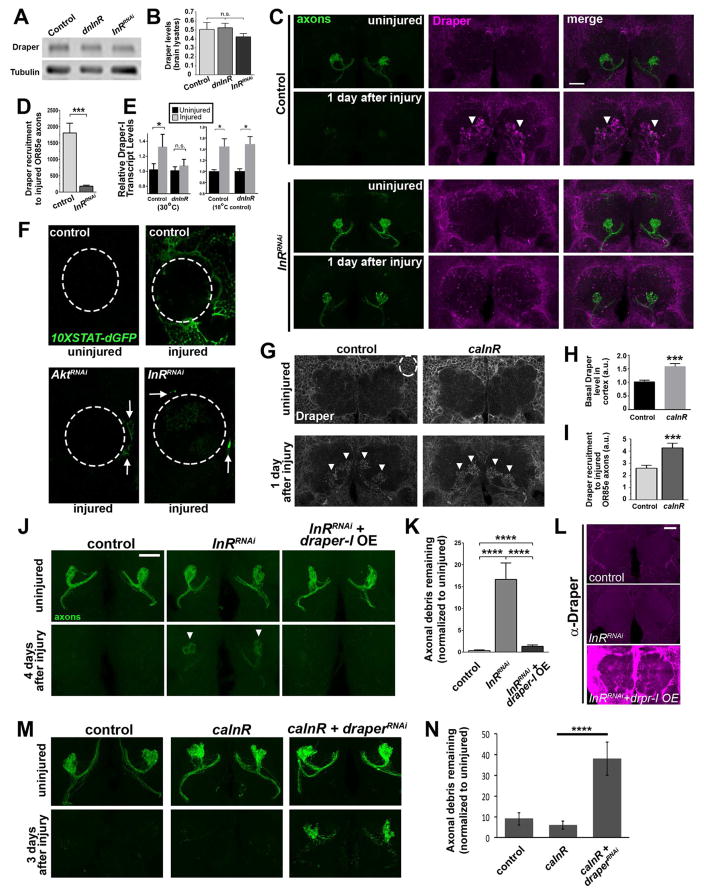
Figure 3. Glial InR signaling positively regulates Draper expression and Draper recruitment to severed axons.
(A) Western blot of fly brain lysates. (B) Quantification of normalized Draper in A. (C) Representative images of adult antennal lobes. Brains stained with Draper (magenta) and GFP to visualize OR85e axons (green). Robust Draper accumulation typically observed post-injury (white arrowheads) is attenuated following glial InRRNAi expression. (D) Volumetric quantification of Draper fluorescence intensity on injured OR85e axons (arrowheads) in C. (E) Q-PCR analysis of draper-I transcript in central brains. 2−ΔΔCt ± SEM values are plotted. N= 6 independent samples of pooled animals for each time point and genotype. (F) Images of single antennal lobes (dotted line) show activation of of 10XSTAT92E-dGFP (destabilized GFP) reporter 18 hours after antennal nerve axotomy in control animals and glial AktRNAi or InRRNAi -expressing flies. (G) Antennal lobe region of uninjured brains (single confocal slice) and 1 day post axotomy (maximum intensity projection) immunostained for Draper. (H) Volumetric quantification of basal Draper levels in the cortex region of uninjured flies (ROI shown with white dotted circle in panel G). (I) Volumetric quantification of Draper accumulation on injured maxillary palp glomeruli (see arrowheads in G). (J) Glial overexpression (OE) of Draper-I reverses glial clearance defects in InR-depleted animals. Representative Z-stack projections of OR85e-innervated glomeruli show GFP+ OR85e axons. (K) Quantification of GFP in J. (L) Images of each experimental genotype shown in J immunostained for Draper. (M) OR85e axons (green) before and after axotomy. (N) Quantification of GFP+ OR85e axonal debris in M. Genotypes in A–E: control (OR85e-mCD8::GFP, tub-Gal80ts/+; repo-Gal4/+), dnInR (OR85e-mCD8::GFP, tub-Gal80ts/+; repo-Gal4, InRex15/UAS-Dominant Negative InR), InRRNAi (OR85e-mCD8::GFP, tub-Gal80ts/+; repo-Gal4, InRex15/UAS-InRRNAi). F: control (10XSTAT92E-dGFP/+; repo-Gal4/+), AktRNAi (10XSTAT92E-dGFP/+; repo-Gal4/UAS-AktRNAi), InRRNAi (10XSTAT92E-dGFP/+; repo-Gal4/UAS-InRRNAi). G–I: control (+/tub-Gal80ts/+; repo-Gal4), caInR (UAS-caInR/ tub-Gal80ts/+; repo-Gal4). J–L: control, InRRNAi (OR85e-mCD8::GFP, tub-Gal80ts/UAS-LacZ; repo-Gal4, InRex15/UAS- InRRNAi), InRRNAi + draper-I OE (OR85e-mCD8::GFP, UAS-Draper-I/tub-Gal80ts; repo-Gal4, InRex15/UAS- InRRNAi). M, N: control (OR85e-mCD8::GFP/+; repo-Gal4/+). caInR (OR85e-mCD8::GFP/UAS-LacZ::NLS, UAS-caInR; repo-Gal4/+). caInR+draperRNAi (OR85e-mCD8::GFP/UAS-draperRNAi, UAS-caInR; repo-Gal4/+). *p < 0.05; ***p < 0.001. ****p< 0.0001. All pooled data are represented as mean ± SEM. All scale bars represent 20 μm. N ≥ 18 for each condition. See Figure S3 and S4.

