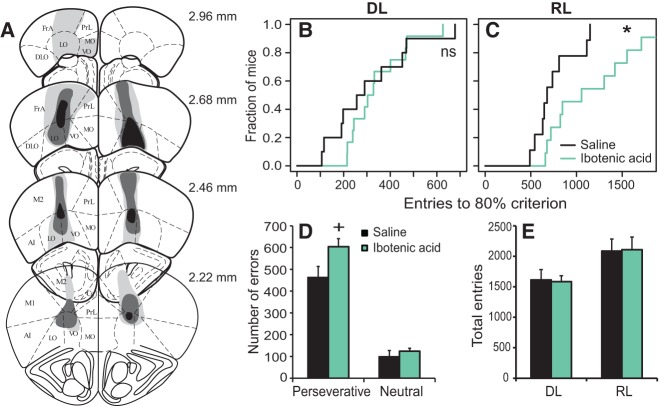
Figure 4.
OFC lesions selectively impair reversal learning. (A) Distribution of lesioned areas, with the maximum extent of lesions denoted by light gray shading and the minimum extent of lesions by black shading. Representative affected areas, present in at least 50% of the mice, are shown in medium gray shading. No damage was observed in sections from the sham-lesion mice. Drawings were adapted from Paxinos and Franklin (2001), with permission of the publisher. (AI) agranular insular cortex, (Cg1) cingulate cortex, area 1, (DLO) dorsolateral orbital cortex, (FrA) frontal association cortex, (LO) lateral orbital cortex, (M1) primary motor cortex, (M2) secondary motor cortex, (MO) medial orbital cortex, (PrL) prelimbic cortex, (VO) ventral orbital cortex. (B) Kaplan–Meier plot of discrimination performance in ibotenic acid lesioned mice (n = 11) and their saline controls (n = 10). (C) Kaplan–Meier plot of reversal learning performance. (D) Number of perseverative and neutral errors made during the RL stage before reaching the 80% learning criterion for both ibotenic acid lesioned and saline control mice. (E) Total number of entries made during discrimination (DL) and reversal learning (RL) as a measure of general activity. (*) P < 0.05; +P < 0.10.

