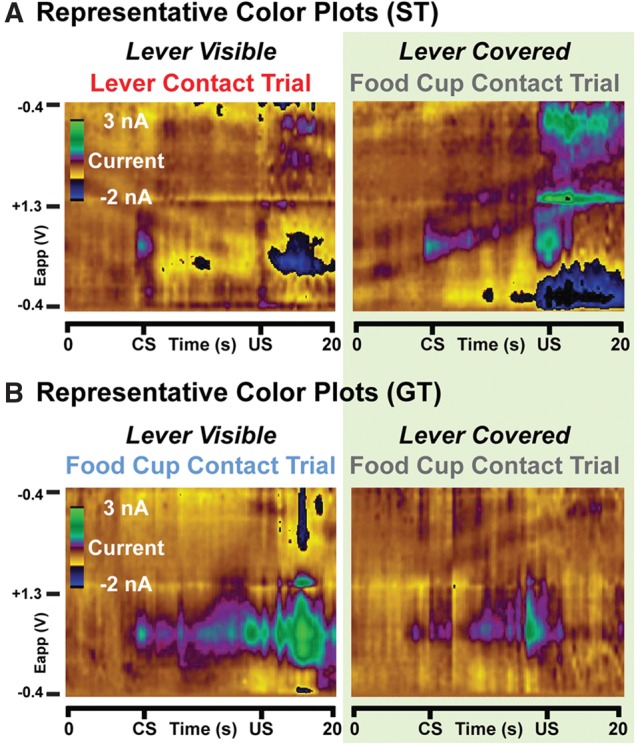
Figure 6.

Representative color plots. (A) Example FSCV recordings of NAc core DA signaling for a ST rat when the lever was visible (left; lever contact trial) or covered (right; food cup contact trial). (B) Representative recordings from a GT rat when the lever was visible (left; food cup contact trial) or covered (right; food cup contact trial). Green shading denotes covered lever trials. Color plots show current changes recorded on the electrode, plotted against the applied voltage (Eapp) and trial time. The holding potential applied to the carbon-fiber electrode (−0.4 V) was ramped to +1.3 V and back to −0.4 V at a rate of 10 Hz.
