Figure 4.
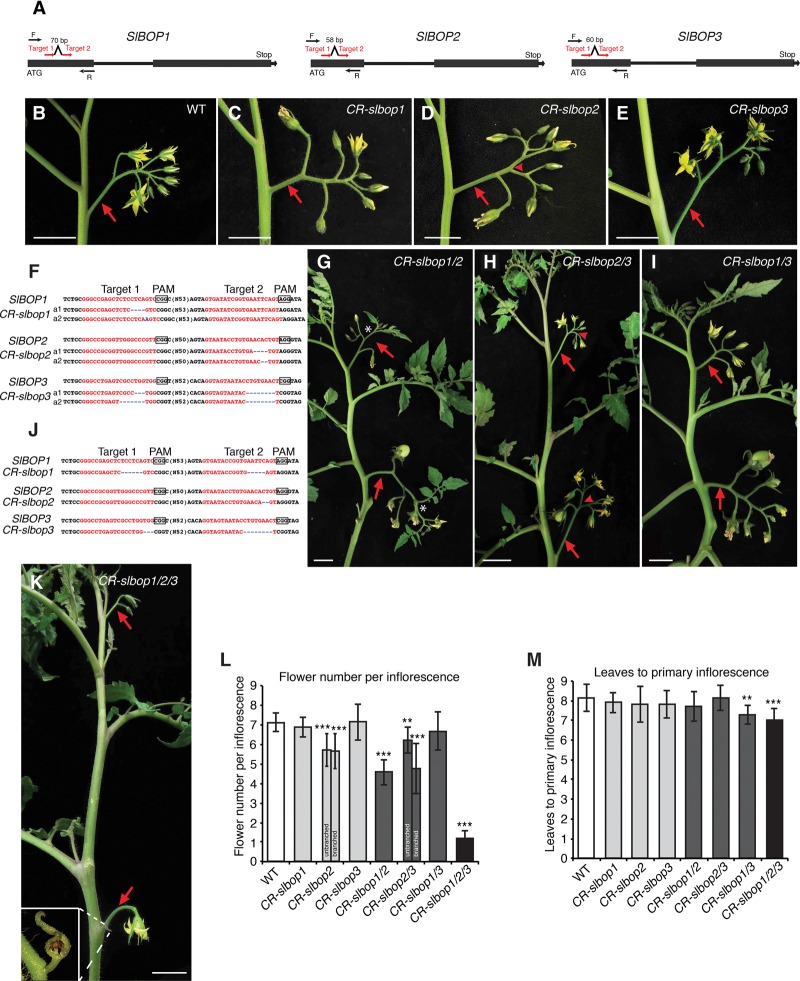
CRISPR/Cas9-engineered mutations in SlBOP genes cause strong inflorescence defects. (A) Schematics illustrating two sgRNAs (red arrows) targeting each SlBOP gene. Black arrows represent PCR genotyping primers. (B–E) A multiflowered inflorescence typical of a wild-type plant (B) and representative inflorescences from single mutants of CR-slbop1 (C), CR-slbop2 (D), and CR-slbop3 (E). The red arrowhead in D indicates a single branching event often observed in CR-slbop2 mutants. (F) Sequences from homozygous T1 transgenic progeny plants lacking the Cas9 transgene showing CRISPR/Cas9-induced out-of-frame deletions (blue dashed lines) for CR-slbop1, CR-slbop2, and CR-slbop3, resulting in two independent null loss-of-function alleles (a1 and a2). The red font highlights sgRNA targets, and black boxes indicate protospacer-adjacent motif (PAM) sequences. (G–I) A representative shoot with two successive inflorescences from CR-slbop1/2 (G), CR-slbop2/3 (H), and CR-slbop1/3 (I) double mutants. The white star in G shows a typical CR-slbop1/2 inflorescence terminating with a leaf or reverting to a vegetative shoot. The red arrowhead in H indicates a single branching event in CR-slbop2/3 double-mutant inflorescences. (J) Sequences showing out-of-frame deletion alleles for each SlBOP gene in the CR-slbop1/2/3 triple mutant. (K) Representative CR-slbop1/2/3 triple-mutant plant showing that all multiflowered inflorescences are transformed into single- or two-flowered inflorescences (arrows). The inset shows an aborted second flower bud with bracts. (L,M) Quantification and statistical comparison of flowers per inflorescence (L) and flowering time (M) in wild-type and CR-slbop single, double, and triple mutants. Note that flower number for CR-bop1/2 plants was quantified as the flowers on each inflorescence before vegetative reversion, and flower number of CR-bop2/3 was quantified as the flowers on each inflorescence branch from branched inflorescences and also unbranched inflorescences separately. Data are means (±SD). n = 12–18 in L; n = 10–15 in M. A two-tailed, two-sample Student's t-test was performed, and significant differences are represented by black asterisks. (**) P < 0.01; (***) P < 0.001. Red arrows indicate inflorescences. Bars: B–K, 2 cm.

