
Figure 2.
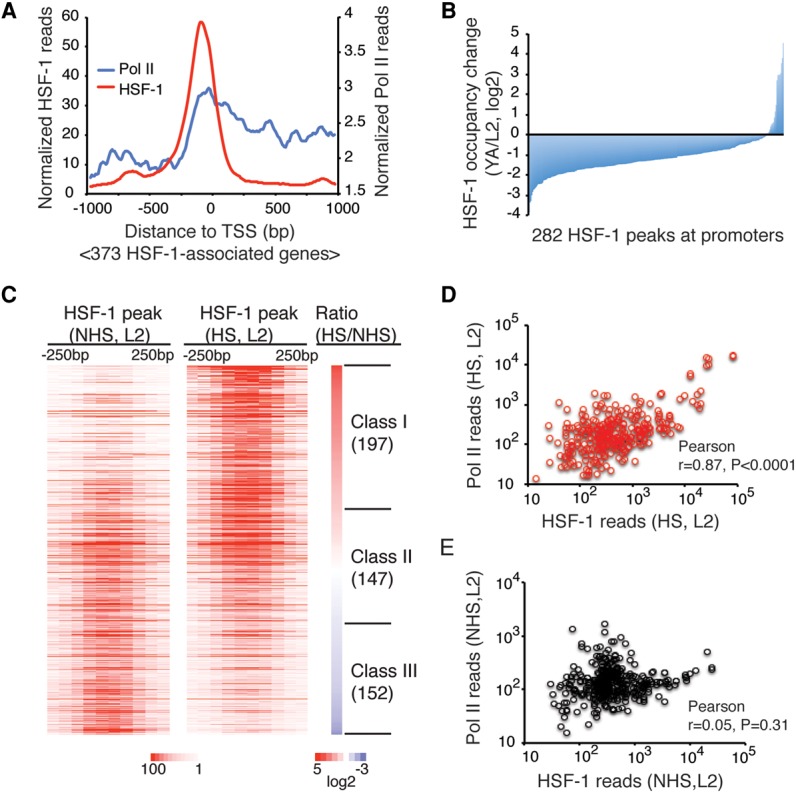
HSF-1 exhibits distinct genomic occupancy in development compared with the HSR. (A) Composite plots of HSF-1 and Pol II ChIP-seq reads within 1000 bp from the TSSs of 373 HSF-1-associated genes in L2 animals at 20°C. HSF-1-associated genes were defined as genes having HSF-1 ChIP-seq peak summits mapped within 1000 bp from the TSS. (B) Histogram of HSF-1 occupancy changes at promoter-associated HSF-1 peaks between L2 and YA animals at 20°C. The 282 peaks whose summits are within 1000 bp from the TSS detected in either L2 or YA animals were included. HSF-1 occupancy was calculated as normalized HSF-1 ChIP-seq reads within 250 bp from the peak summits. (C) Heat maps of normalized HSF-1 reads at ChIP-seq peaks (mapped to 50 bp bins, ±250 bp from peak summits) in L2 animals grown at 20°C without heat shock (NHS) or exposed for 30 min to 34°C heat shock (HS). Peaks were ranked by the ratio of HSF-1 reads in heat shock compared with without heat shock. The peaks with increased or decreased HSF-1 occupancy by 1.5-fold in heat shock were grouped into class I or class III, respectively, and the remaining peaks with similar HSF-1 occupancy were grouped into class II. The number of genes associated with each class of peaks is shown in parentheses. (D,E) Scatter plots of HSF-1 (−600 to +400 bp) and Pol II (−500 to +1000 bp) ChIP-seq reads at HSF-1-associated promoters from L2 animals in heat shock (D; 313 genes) and without heat shock (E; 373 genes).