Figure 4.
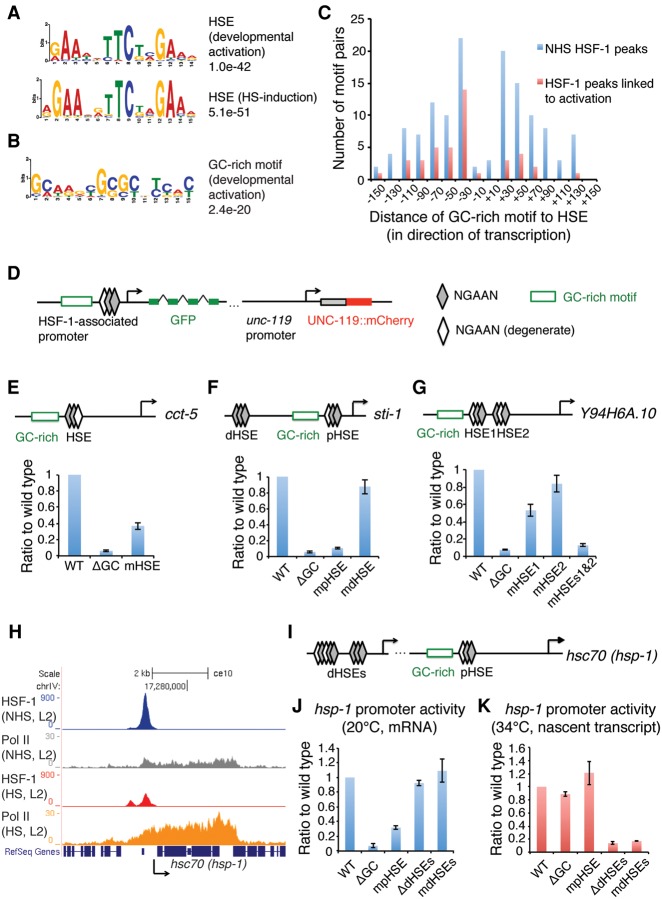
HSF-1 transcriptional activities in development require a unique promoter architecture. (A) The HSEs derived from HSF-1 ChIP-seq peaks that are either associated with HSF-1-activated genes in development and correspond to degenerate HSEs (top) or induced upon heat shock and correspond to canonical HSEs comprised of three inverted pentamer NGAAN sequences (bottom). Genes associated with HSF-1 ChIP-seq peaks within 1000 bp from the TSS and significantly increased expression (twofold or more; FDR 0.05) upon heat shock are defined as induced genes. (B) A GC-rich motif derived from HSF-1 ChIP-seq peaks associated with HSF-1-activated genes in development. (C) Histograms representing the position relationship of the GC-rich motif and HSE at HSF-1 ChIP-seq peaks in L2 animals at 20°C. HSF-1 peaks within 1000 bp of TSSs were included. HSF-1 peaks linked to activation are those at the promoters of HSF-1-activated genes in development. (D) Schematic representation of a transcriptional reporter system used to assay HSF-1 developmental targets. The unc-119p::unc-119::mCherry internal reference reporter is on the same construct of the GFP transcriptional reporter. (E–G) RT-qPCR analysis of transcriptional reporters of the cct-5 (E), sti-1 (F), and Y94H6A.10 (G) genes in L2 animals at 20°C. The mRNA levels of GFP were normalized to the mRNA levels of mCherry to calculate promoter activity. The relative activity of promoter variants carrying either mutations of the HSE (mHSE) or deletion of the GC-rich motif (ΔGC) is shown as the ratio to the wild-type (WT) promoters. (pHSE) Proximal HSE; (dHSE) distal HSE. Shown at the top of each panel is a schematic of the cct-5, sti-1, and Y94H6A.10 promoters, with the arrow indicating the TSS and direction of transcription. Error bars represent the SEM of biological triplicates. (H) Gbrowser view of HSF-1 and Pol II occupancy at the hsc70 (hsp-1) gene locus in L2 animals with or without heat shock. (I) Schematic representation of the hsc70 (hsp-1) promoter. The two arrows indicate the distal and proximal TSSs, respectively. (J,K) RT-qPCR analysis of transcription reporters of the hsc70 (hsp-1) gene in L2 animals at 20°C (J) or with a 30-min heat shock at 34°C (K). Because of the high abundance of hsc70 (hsp-1) mRNA at 20°C, the newly synthesized nascent transcript during heat shock was measured to calculate promoter activity at 34°C. (mdHSEs) Mutation of both distal HSEs; (ΔdHSEs) deletion of the region containing both distal HSEs.

