
Figure 2.
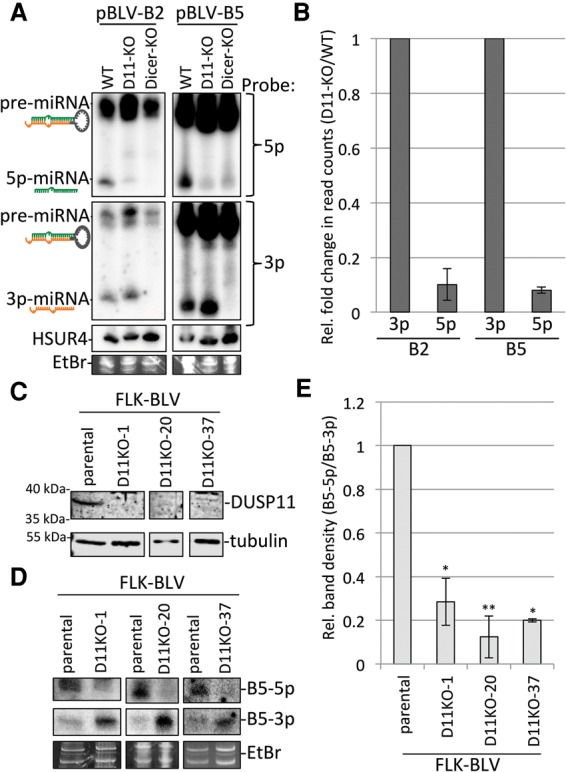
Knockout of DUSP11 decreases the accumulation of BLV 5p miRNAs. (A) Northern blot analysis of BLV-B2 and BLV-B5 miRNAs in parental (wild-type [WT]), DUSP11 knockout (D11-KO), and NoDice-2-20 (Dicer-KO) HEK293T cells. Cells were cotransfected with transfection control vector, pHSUR4, and each BLV miRNA expression vector. The membrane was first blotted with probes specific for the 5p miRNAs, stripped, reprobed for the 3p miRNAs, stripped, and reprobed for HSUR4 RNA. (B) Next-generation small RNA sequencing in parental (wild-type) and DUSP11 knockout HEK293T cells transiently expressing the BLV-B2 and BLV-B5 miRNAs. Bars represent the average fold change (DUSP11 knockout/wild-type) in a number of small RNA reads of the most abundant isoform of each indicated miRNA (Supplemental Fig. S3A) from two independent experiments ±the standard deviation. n = 2. The fold change of the 5p miRNAs was normalized to the fold change of the corresponding 3p miRNAs. (C) Western blot analysis of DUSP11 in parental FLK-BLV cells (fetal lamb kidney cells persistently infected with BLV) and various FLK-BLV-DUSP11 knockout cell lines (D11KO-1, D11KO-20, and D11KO-37). (D) Northern analysis of the BLV-B5 miRNAs in the parental, D11KO-1, D11-KO-20, and D11KO-37 FLK-BLV cell lines. The membrane was first probed for the 3p miRNA, stripped, and reprobed for the 5p miRNA. (E) Quantitation of the relative band density (5p/3p) of the BLV-B5 miRNAs by Northern blot analysis. Bars represent the average ± the standard deviation from three experiments. Values were normalized to the parental cells. The P-values were calculated using one sample t-test. (*) P < 0.05; (**) P < 0.005.