
Figure 1.
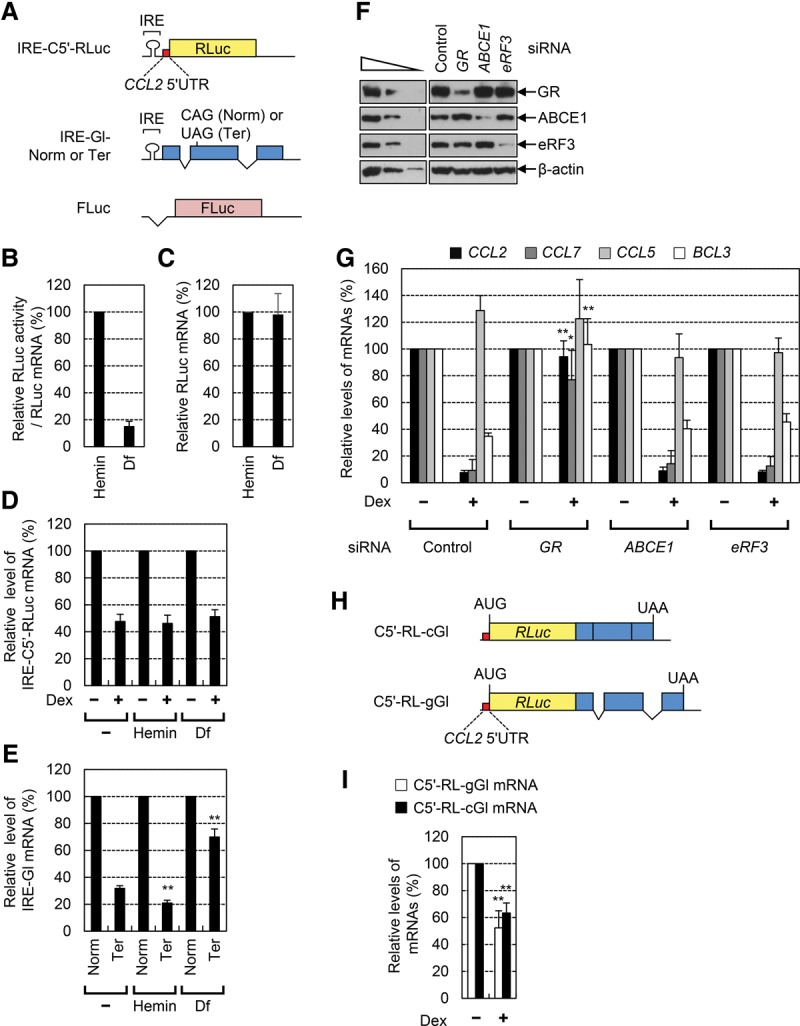
GMD is a unique mRNA decay pathway, which occurs independently of a translation event and EJC. (A) A schematic of IRE-containing GMD and NMD reporter constructs. Details are described in the Results. (B–E) The effects of a translation event on GMD and NMD. HeLa cells transiently expressing either GMD or NMD reporter mRNAs and FLuc mRNA were either treated or not treated with hemin or desferal (Df) for 18 h before harvesting. (B,C) The change in translational efficiency (B) and the level (C) of reporter mRNA depending on intracellular iron concentration. The RLuc activities were normalized to FLuc activities. The levels of RLuc mRNAs were also normalized to the levels of FLuc mRNAs. Translational efficiencies were calculated by dividing the normalized RLuc activities by normalized RLuc mRNAs. (D) Relative levels of GMD reporter mRNAs. The cells were either treated or not treated with dexamethasone (Dex) 12 h before harvesting. The levels of IRE-C5′-RLuc mRNAs were normalized to the levels of FLuc mRNAs. The normalized levels of IRE-C5′-RLuc mRNAs in the cells untreated with Dex were arbitrarily set to 100%. (E) Relative levels of NMD reporter mRNAs. The levels of IRE-Gl mRNAs either Norm or Ter were normalized to the levels of FLuc mRNAs. The normalized levels of IRE-Gl-Norm mRNAs were arbitrarily set to 100%. (F,G) The effects of down-regulation of ATP-binding cassette subfamily E member 1 (ABCE1) and eukaryotic translation release factor 3 (eRF3) on GMD. (F) Specific down-regulation of GR, ABCE1, and eRF3 was demonstrated by Western blotting. For the purpose of quantitative comparison, threefold serial dilutions of total cell extracts were loaded in the three left lanes. (G) The levels of endogenous GMD substrates and a control mRNA (CCL5 mRNA) were normalized to endogenous GAPDH mRNAs. (H) A schematic of GMD reporter constructs either containing or not containing introns. (I) The effect of an intron and EJC on GMD. The columns and bars in each panel represent the mean and standard deviation of three independent biological replicates. n = 3. Two-tailed, equal-sample variance Student's t-tests were used to calculate the P-values. (**) P < 0.01; (*) P < 0.05.