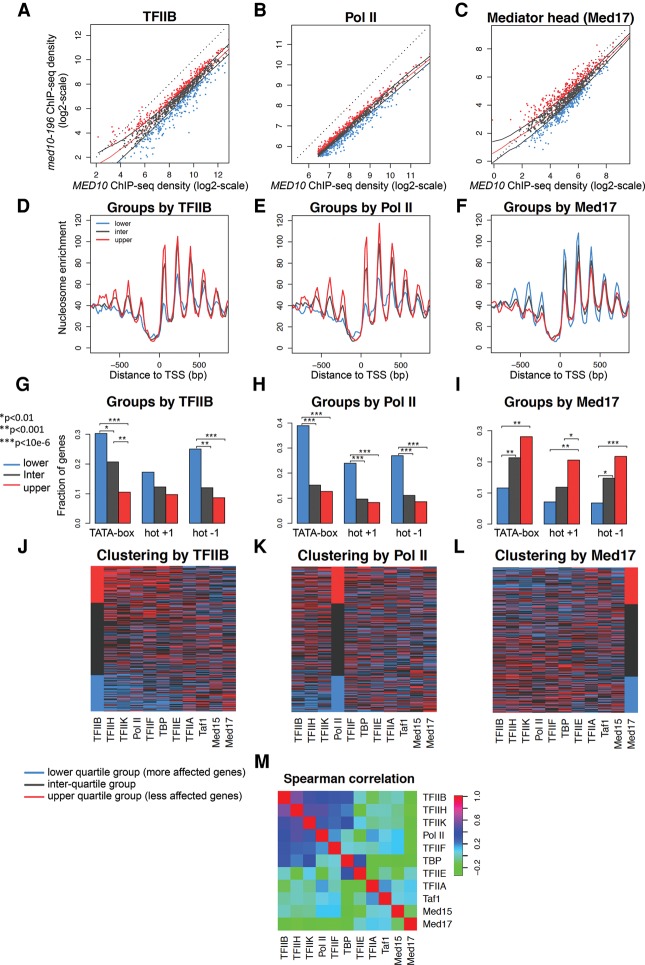
Figure 5.
Clustering analysis of genome-wide PIC occupancy ratios between med10-196 and the wild type. (A–C) ChIP-seq tag densities in the mutant versus the wild type were plotted as in Figure 4 but with log2 scales. To aggregate data at the gene level, divergent genes with double peaks for GTFs were excluded from the analysis as well as intergenic regions encompassing Pol III transcribed genes and centromeric regions. The genes with the lowest Pol II occupancy (lowest 25%) were also excluded from the analysis. For each PIC component, three groups of genes were defined according to the occupancy ratios between the med10-196 mutant and the wild type: the lowest 25% (lower quartile group in blue), the highest 25% (upper quartile group in red), and the ratios between 25% and 75% (interquartile group in gray). The red line corresponds to the median trend, and black lines correspond to the first and third quartiles of the data. Blue points correspond to the lowest 25% of mutant/wild-type values, and gray points correspond to values between 25% and 75% of the mutant/wild type. The red points correspond to the 25% of the genes that have the highest mutant/wild-type ratio. Tag densities were calculated as described in the legend for Figure 4 and were analyzed for the TFIIB (A,D,G,J), Pol II (B,E,H,K), and Mediator (Med17) groups (C,F,I,L). (D,E,F) The groups determined by TFIIB (A), Pol II (B), and the Mediator Med17 subunit (C) were analyzed for nucleosome occupancy in a 1600-base-pair (bp) window centered on the TSS. P-values determined by Wilcox test for the differences between the gene groups for the maximum values of nucleosome occupancy on the region between 0 and 100 bp relative to the TSS were as follows: For TFIIB groups, lower quartile versus interquartile was 3 × 10⁻⁶, interquartile versus upper quartile was <10 × 10−12, and lower quartile versus upper quartile was <10 × 10−12; for Pol II groups, lower quartile versus interquartile was 6 × 10⁻⁴, interquartile versus upper quartile was 6 × 10⁻³, and lower quartile versus upper quartile was 7 × 10⁻⁶; and for Med17 groups, interquartile versus upper quartile was 0.002, and lower quartile versus upper quartile was 6 × 10⁻⁵. (G–I) The groups determined by TFIIB (A), Pol II (B), and the Mediator Med17 subunit (C) were analyzed for the presence of the TATA box for dynamic (hot) nucleosomes −1 and +1. P-values determined by Fisher test are indicated by asterisks with a value key in the left panel. (J–L) The heat maps clustered by the TFIIB groups (J), Pol II groups (K), and Med17 groups (L) summarize the group distribution according to the occupancy ratios between the mutant and the wild type for each GTF, Mediator subunit, and Pol II. For each PIC component, lower quartile group genes are colored in blue, interquartile group genes are gray, and upper quartile group genes are red. The genes are ordered in the heat maps inside each group by interquartile range (IQR) score. (M) Pair-wise Spearman correlations between mutant and wild-type ratios for each PIC component were calculated. The correlated PIC components (>0.48) were TFIIB, TFIIH, TFIIK, and Pol II.

