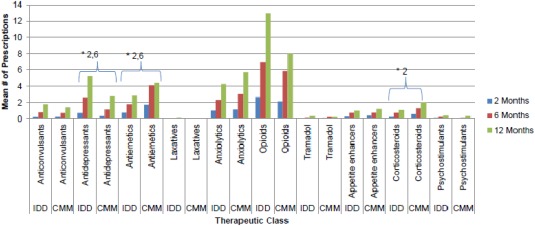
Figure 2.

Pharmacy utilization by treatment group over 12 months. * Indicates a statistically significant difference at the p < 0.05 level for the time point(s) listed. No adjustments made for multiple comparisons. CMM, conventional medical management; ED, emergency department; ICU, intensive care unit; IDD, intrathecal drug delivery; IP, inpatient; LOS, length of stay; OP, outpatient.
