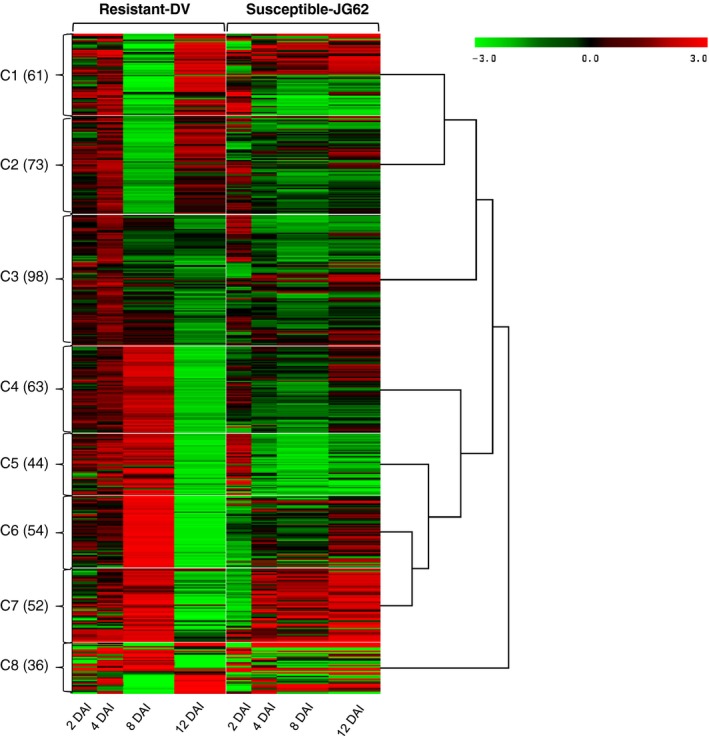
Figure 1.

Clusters (C1 to C8) of 481 differential expressed proteins in chickpea root. For each protein, the ratio of Log2‐normalized expression of Foc inoculated with its respective control at various stages (2 to 12 DAI) and represented by a colour, according to the colour scale at the top. The number of proteins in a given cluster with similar expression trend is indicated in parentheses.
