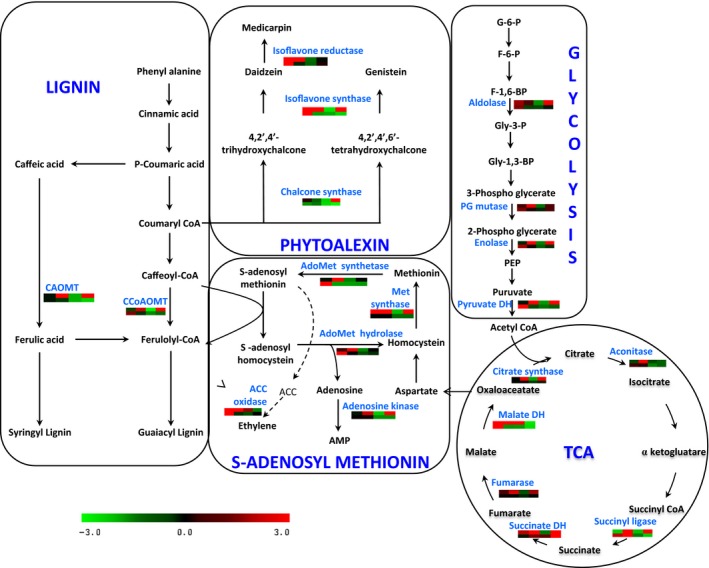
Figure 2.

Interconnection between various metabolic processes in chickpea–Foc interaction. Each graph represents differential expression (fold change) pattern according to the colour scale; columns represent the four stages (2 to 12 DAI) after Foc inoculation. The first row represents the resistant cultivar, while the second row represents the susceptible cultivar.
