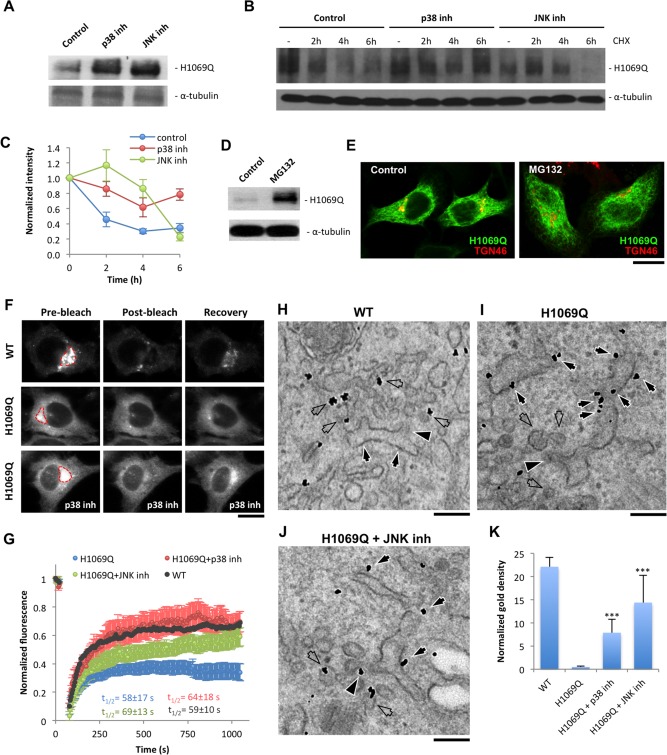
Figure 8.

p38 and JNK inhibitors reduce degradation of ATP7BH1069Q mutant and improve its sorting into the secretory pathway. (A) HepG2 cells were infected with Ad‐ATP7BH1069Q and treated with p38 or JNK inhibitor. Western blot revealed an increase in the amount of ATP7BH1069Q after suppression of p38 or JNK. (B,C) HepG2 cells expressing ATP7BH1069Q were treated with p38 and JNK inhibitors and then exposed to 100 μM cycloheximide for different time intervals. Western blot (B) and quantification of ATP7BH1069Q bands (C) showed a decrease of ATP7BH1069Q signals (means ± standard deviation, n = 3 experiments) in control cells exposed to cycloheximide, while p38 and JNK inhibitors attenuated the decay of ATP7BH1069Q levels. (D,E) HepG2 cells expressing ATP7BH1069Q were treated with 20 μM of the proteasome inhibitor MG132. Although western blot indicated an increase in ATP7BH1069Q protein levels (D), the localization of the mutant (E) was similar in control and MG132‐treated cells. (F,G) HeLa cells expressing either ATP7BWT‐GFP or ATP7BH1069Q‐GFP were observed in vivo. p38 or JNK inhibitor was added to some ATP7BH1069Q‐GFP‐expressing cells 24 hours before the experiment. The GFP signal within the Golgi area (outlined in red) was photo‐bleached (see Materials and Methods), and the kinetics of its recovery in the bleached region was analyzed. Both time‐lapse images (F) and a kinetics plot (G) revealed more efficient recovery of ATP7BWT‐GFP in comparison to the mutant. Incubation with p38 or JNK inhibitor led to recovery of higher ATP7BH1069Q‐GFP levels (means ± standard deviation, n = 6 cells) in the bleached Golgi area (F,G), although the half time (t 1/2) of the recovery process remained similar in control and treated cells (G). (H‐K) HepG2 cells expressing ATP7BWT‐GFP or ATP7BH1069Q‐GFP were fixed and prepared for immuno‐EM with anti‐GFP antibody. Some of the ATP7BH1069Q‐GFP‐expressing cells were incubated with p38 or JNK inhibitor. ER (arrows), buds (arrowheads), and ERES vesicular/tubular profiles (empty arrows) are indicated in (H‐J). (K) An increase in normalized density of gold particles associated with ATP7BH1069Q‐GFP (means ± standard deviation, n = 20 ERES) at the ERES structures in inhibitor‐treated cells. Scale bars = 6.5 μm (E), 5 μm (F), and 180 nm (H‐J). Abbreviations: CHX, cycloheximide; inh, inhibitor; WT, wild type.
