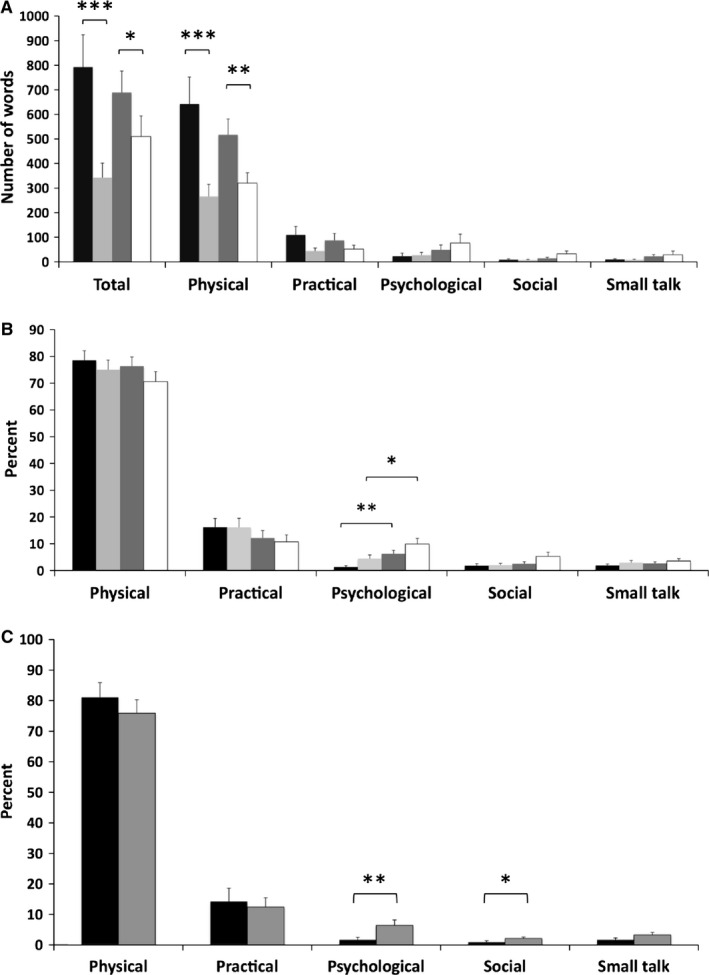
Figure 1.

The number of words in the precourse and postcourse conversations (A) and their percentual distribution (B) in the different categories. (A) and (B): Black, nurses before the course; light grey, parents before the course; dark grey, nurses after the course; white, parents after the course. ***, p < 0.0001; **, p < 0.01; *, p < 0.05. Mann–Whitney test. (C) Pairwise comparison of the precourse and postcourse percentages of words in the different categories for each individual nurse. Black, nurses before the course; dark grey, nurses after the course. **, p < 0.01; *, p < 0.05. Wilcoxon signed‐rank test.
