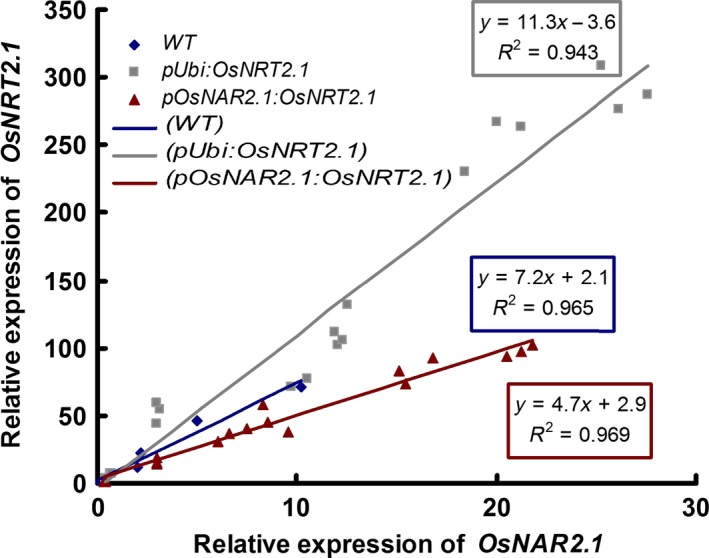
Figure 5.

Ratios of OsNRT2.1 to OsNAR2.1 expression in culms of the wild‐type (WT) and transgenic lines over the course of the study. The ratios of OsNRT2.1 and OsNAR2.1 expression during different periods in the culms of pUbi:OsNRT2.1 lines (OE1, OE2 and OE3), pOsNAR2.1:OsNRT2.1 lines (O6, O7 and O8) and WT were presented.
