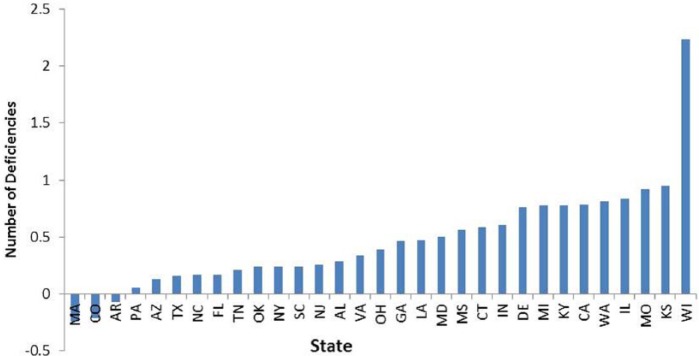
Figure 2.
Site-of-care disparities between NHs with high concentrations of racial/ethnic minority residents (≥35%) and NHs with low minority concentrations (<5%) in average number of quality of life deficiencies, in 2011 and by state.
Note. States are not included here if, in 2011, they had less than five NHs in the group of low minority concentrations (Hawaii and New Mexico) or less than five NHs in the group of high minority concentrations (Alaska; Washington, D.C.; Iowa; Idaho; Maine; Minnesota; Montana; North Dakota; Nebraska; New Hampshire; Nevada; Oregon; Rhode Island; South Dakota; Utah; Vermont; West Virginia; and Wyoming). NH = nursing home.

