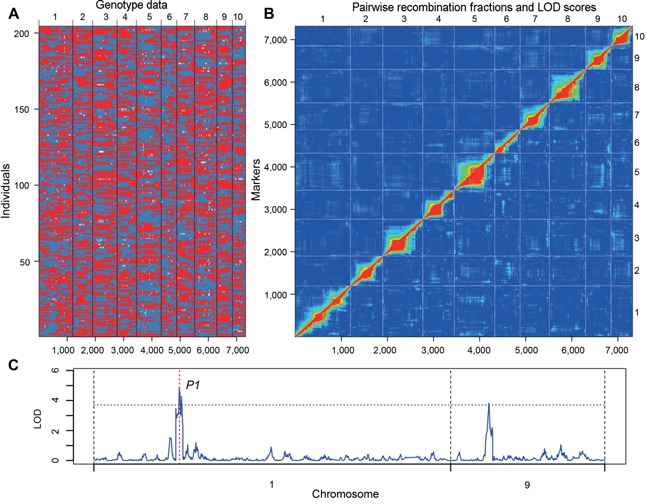
Figure 2.

Recombination bin‐map of recombinant inbred line (RIL) population and quantitative trait loci (QTL) mapping of silk color P1 (pericarp1) (A) The bin‐map consists of 7 319 bin markers inferred from 248 168 high‐quality SNPs in the RIL population and has a total genetic distance of 2812 cM. The physical position of the markers is based on the B73 RefGen_V2 sequence. Red: Chang7‐2 genotype; Blue: Zheng58 genotype; White: heterozygote. (B) Pairwise recombination fractions (upper left) and logarithm (base 10) of odds (LOD) scores for tests of linkage (bottom right) for all markers were calculated and graphed as a heatmap. Marker and chromosome numbers are provided in the axis labels. Red corresponds to low recombination or a high LOD score, while blue represents unlinked markers. (C) The composite interval mapping (CIM) plot for silk color shows the QTL identified on chromosomes 1 and 9. The location of the pigment gene pericarp color1 (p1) is indicated by red dashed lines.
