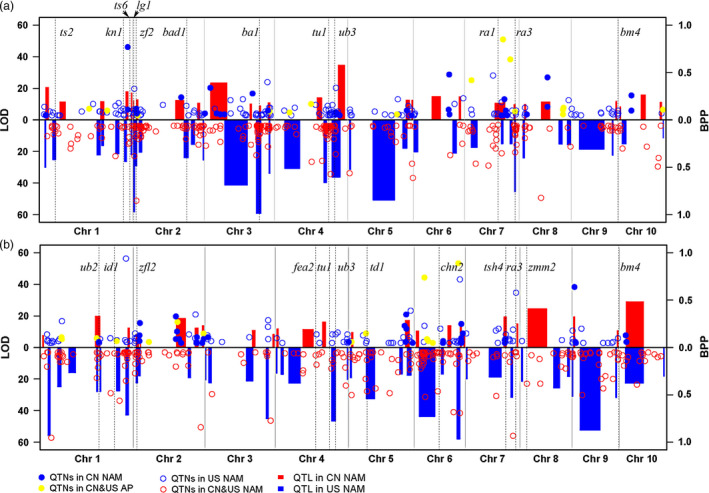
Figure 1.

Genetic loci controlling phenotypic variations of tassel‐related traits. ‘a’ showed the genetic loci significantly associated with tassel primary branch number (TBN), and ‘b’ showed the genetic loci significantly associated with tassel length (TL). The rectangles filled with red and blue colour were quantitative trait loci (QTL) identified in CN NAM and US NAM, respectively, with rectangle width to be QTL interval supported by joint‐linkage. Logarithm of odds (LOD) value of QTL was ruled on the left of each plot. Circles and dots with different colours of lines represented QTNs found in different populations, independently. Dashed lines showed tassel‐related genes cloned using maize mutants, previously. ‘QTL in CN NAM’ and ‘QTL in US NAM’ meant QTL identified in the China nested association mapping population and US nested association mapping population, respectively. ‘QTNs in CN&US AP’, ‘QTNs in CN&US NAM’, ‘QTNs in US NAM’, ‘QTNs in CN NAM’ and ‘QTNs in CN AP’ represented quantitative trait nucleotides (QTNs) identified in a combination of Chinese and USA association panels, a combination of Chinese and USA nested association mapping populations, the USA nested association mapping population, the Chinese nested association mapping population and the Chinese association panel, respectively.
