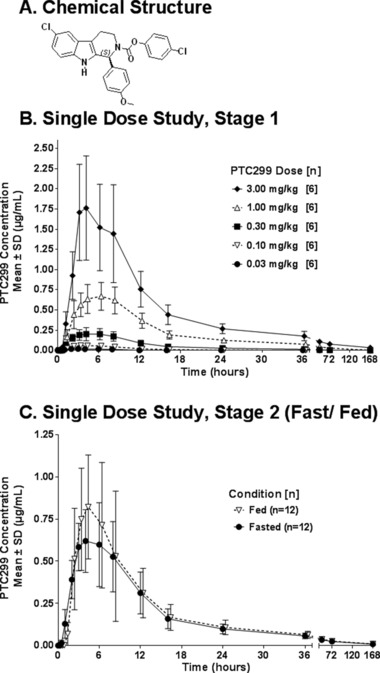
Figure 1.

Chemical structure of PTC299 and plasma concentrations of PTC299 by dose level after a single dose of PTC299: stage 1 and stage 2. (A) Chemical structure. (B) Plasma concentrations of PTC299 by dose level in fasting subjects receiving single doses of PTC299. (C) Plasma concentrations of PTC299 by fed‐fasting status in subjects receiving single doses of 1 mg/kg PTC299. Fed subjects received PTC299 within 30 minutes after a high‐fat, high‐calorie meal. Fasted subjects had not eaten for ≥10 hours before PTC299 administration. A value of zero was used for calculating mean values if the measured concentration was below the lower limit of quantification.
