
Figure 3.
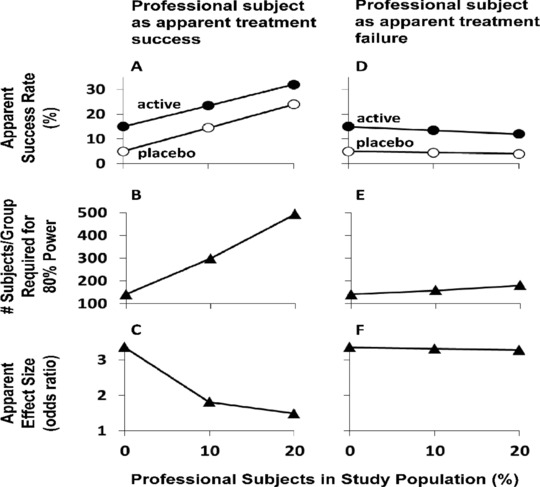
Impact of professional subjects who appear to achieve treatment success (A‐C) or treatment failure (D‐F) on an efficacy trial with a binary success/failure outcome. A and D: Apparent success rate, with success of appropriate subjects set at 15% for active medication (filled circles) and at 5% for placebo (open circles). B and E: Number of subjects/group required to achieve 80% power in detecting a significant treatment effect (α = 0.05; 2‐sided). C and F: Apparent effect size (odds ratio); in all cases there is an equal distribution of professional subjects among the placebo and active medication groups. This figure was reproduced from McCann et al11 with permission of the publisher.