Fig. 4.

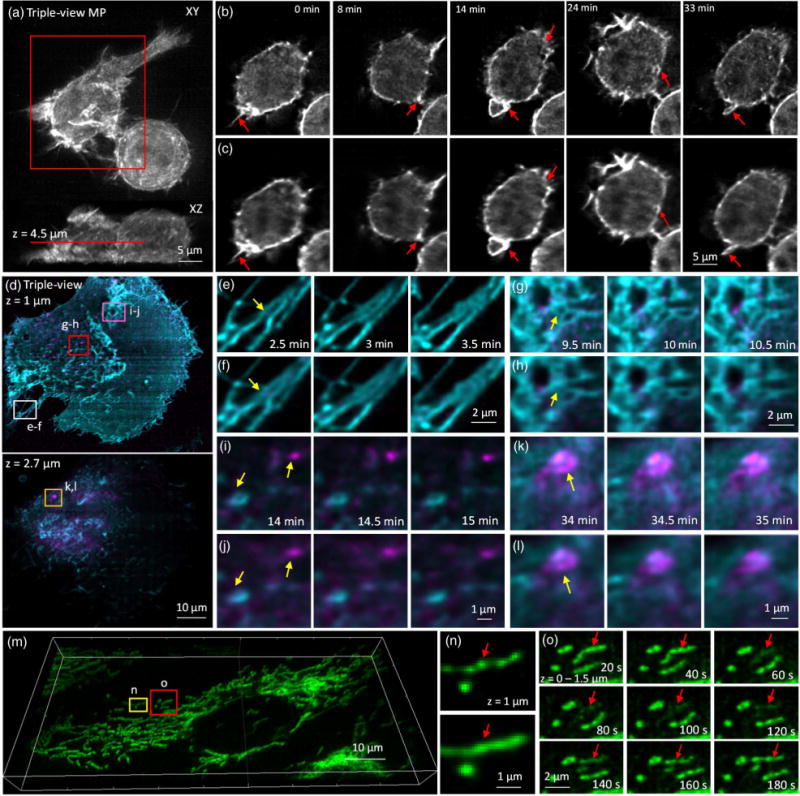
Triple-view light-sheet microscopy improves lateral resolution relative to dual-view light-sheet microscopy. (a) Maximum intensity projection of F-tractin-EGFP in RAW 264.7 macrophage, after triple-view fusion and deconvolution. (b) Higher magnification lateral views of red rectangular region in (a), 4.5 μm from the coverslip surface. Comparative images from dual-view imaging (c) are also shown. Red arrows mark actin protrusions, forming membrane ruffles and filopodia, which are better resolved in triple- than dual-view imaging. See also Visualization 5 and Visualization 6. (d) Two-color imaging of GFP-Ras and mCherry-Rab8 in U2OS cells after triple-view imaging. Lateral planes 1 μm (upper) and 2.7 μm (lower) from the coverslip are shown. Comparative images highlight resolution improvement (yellow arrows) of triple-view [(e), (g), (i), and (k)] relative to dual-view [(f), (h), (j), and (l)] light-sheet imaging, especially in fine structures such as filopodia [(e) and (f)], reticular structures within the plasma membrane [(g) and (h)], and intracellular vesicles and endosomes [(I),(j) and (k),(l)]. Higher magnification images [(e)–(l)] correspond to rectangular regions in (d); see also Visualization 7 and Visualization 8. (m) Mitochondria in U2OS cells were labeled with Mitotracker Red and imaged in triple-view light-sheet microscopy. Imaris rendering is shown. (n) Comparison between triple-view (upper) and dual-view (lower) imaging shows that the nonhomogenous, “beads on a string” staining of mitochondria is better resolved in triple-view imaging. Images are maximum intensity projections over 1.5 μm, and correspond to yellow rectangular region in (m). (o) Higher magnification views of red boxed region in (m) (maximum intensity projections over 1.5 μm) highlighting loss and gain in mitochondrial membrane potential (red arrows) over time. See also Visualization 9. For dual-view deconvolution, 60 iterations were used; for triple-view deconvolution, 180 iterations were used for (a) and (b), 120 iterations for the green channel in (d)–(l), and 100 iterations for the red channel in (d)–(o).
