
Figure 2. Survival curves according to Gompertz, Weibull and the mixture model of Levy and Levin.
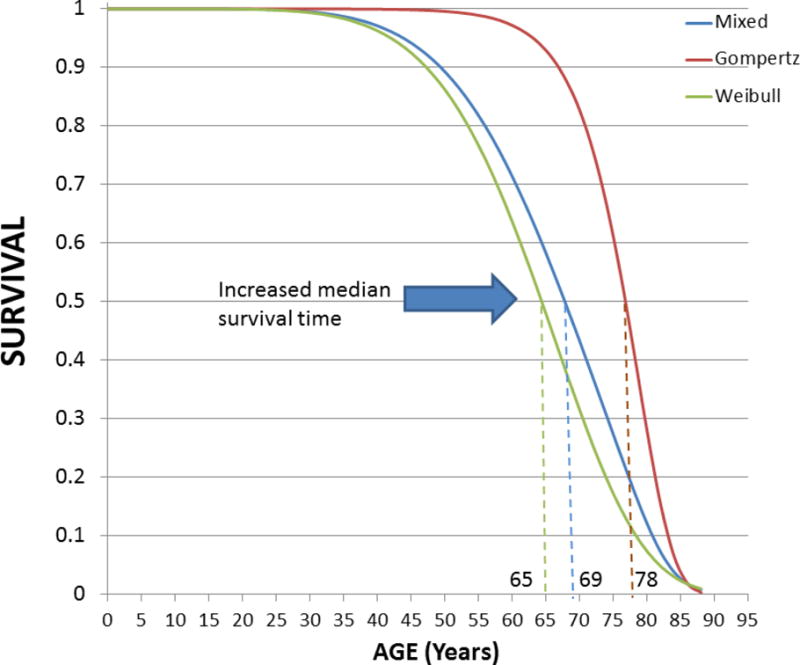
The evolutionary biology-based mixture model of Levy and Levin encompasses Gompertz and Weibull components [55]. Notice the increase in the median survival time from the Weibull, to the mixed and the Gompertz distributions (dashed lines). A visible decline in the survival function starts at 35–40y for the Weibull and mixed distributions whereas the decline is only noticeable at about 60–65y for the Gompertz component, accelerating at ~75y, and then showing a steep decline between ~80–90y while approaching an overall rectangular form. At 80y, ~10% and ~35% of the population is alive according to the mixed and Gompertz components, respectively. Prevention of premature deaths (e.g., accidental, neonatal and infant) would bring population survival closer to the Gompertz component of the mixture model. The index of aging-relatedness applied to intrinsic mortality data is a measure of “living life to the fullest” (rectangularization of the survival curve) thus representing a quantitative characterization of health span.