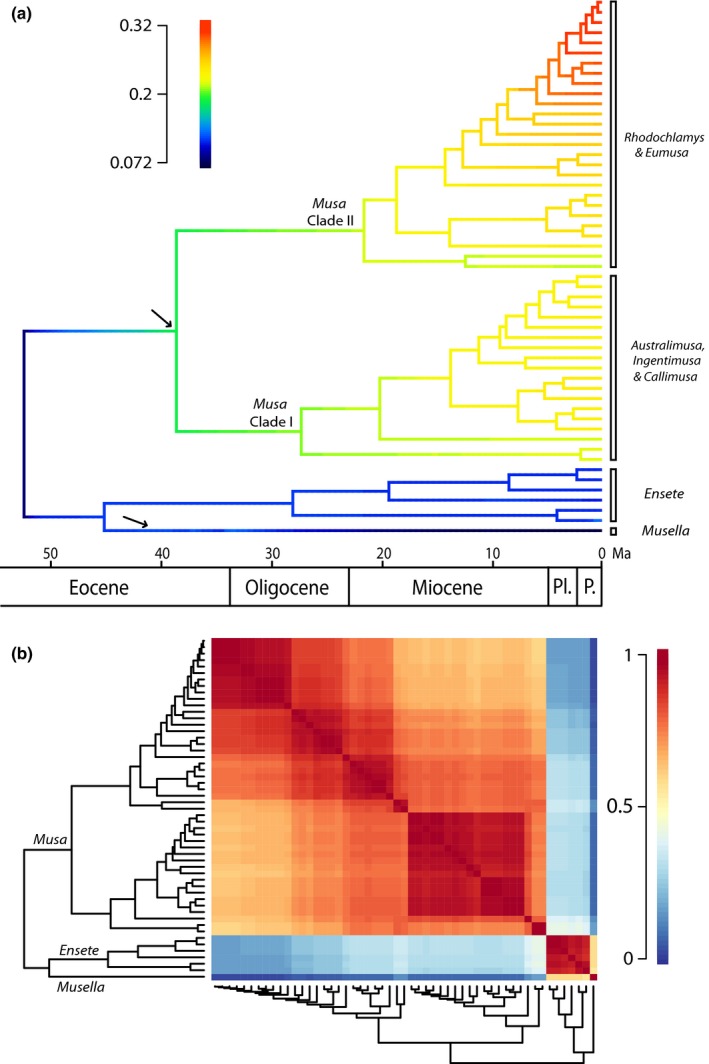
Figure 4.

Diversification patterns in Musaceae. (a) Phylorate plot with estimates of net diversification rates of the Musaceae phylogenetic tree obtained from the Bayesian analysis of macroevolutionary mixtures (BAMM) analyses. Colors at each time along the branches indicate net diversification rates. Arrows indicate shifts in diversification rate based on shifts in marginal probability along the phylogram. (b) Macroevolutionary cohort matrix for speciation in Musaceae. Every cell in the matrix is coded by a color indicating the pairwise probability between two lineages and their common macroevolutionary rate regime. Dark red indicates a pairwise probability of 1, whereas a deep blue color marks a pairwise probability of shared macroevolutionary dynamics of 0. In total, three major cohorts could be identified representing a different rate regime for each Musaceae genus. In addition, within each genus, rate dynamics are highly correlated.
