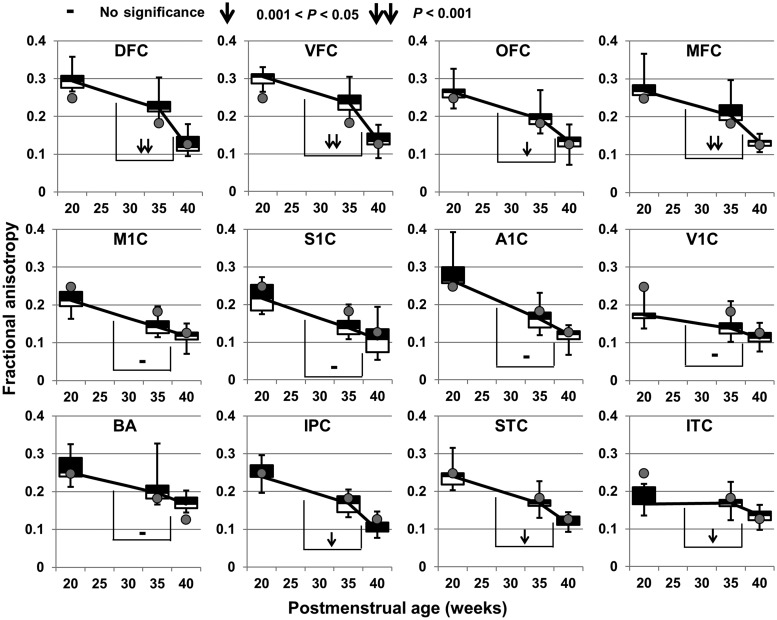
Figure 5.
Distinctive time courses of FA decreases at 12 cortical ROIs during 20–35 and 35–40 weeks. The FA values averaged across all cortical ROIs are shown as gray dots at each time point. FA measurements of cortical ROI from all subjects at a certain age are shown as boxplots. See the caption of Figure 1 for abbreviation of cortical ROIs. The symbols on the bridges connecting 2 FA descending lines during 20–35 and 35–40 weeks demonstrate the statistical significance of the descending slope differences, that is, the significance of acceleration of FA decrease at a certain cortical ROI in 35–40 weeks. All P-values were calculated after Bonferroni correction.

