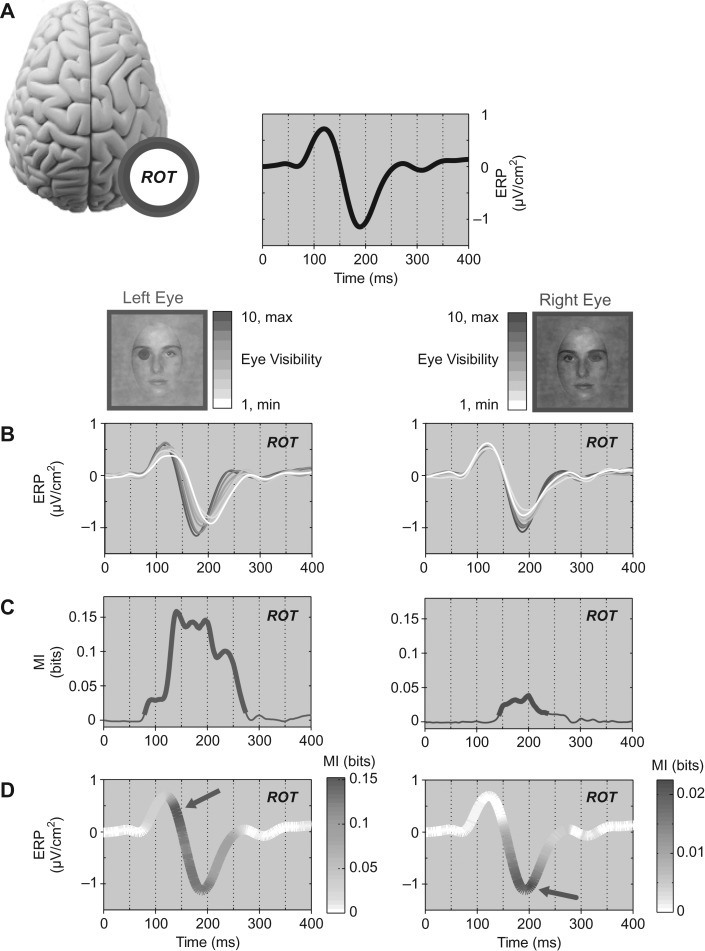
Figure 3.
Coding. (A) The ERP measured on ROT for a typical observer (black curve). For this observer, ROT was selected as electrode B9 in the Biosemi coordinate system, which is posterior to PO8 (on the same radial axis). The left eye and right eye schematics illustrate with their color-coded blue and red scales the deciles of eye visibility across experimental trials (with 10 = highest eye visibility trials and 1 = lowest). (B) We recomputed ROT ERPs using only the trials from each decile of left and right eye visibility, to illustrate how eye visibility modulates ERPs. (C) CMI between left eye (blue curve) and right eye (red curve) visibility and corresponding ROT EEG response (a thicker line indicates regions of statistically significant MI, referred to as left and right eye coding). (D) CMI curves visualized over the ERP curve to precisely indicate when, over the time course of the ERP, eye coding peaks (indicated with a color-coded arrow). Across observers and stimulus features we found 26 instances (out of 30 = 15 observers × left/right eye) of significant eye CMI on both contralateral and ipsilateral sensors.

