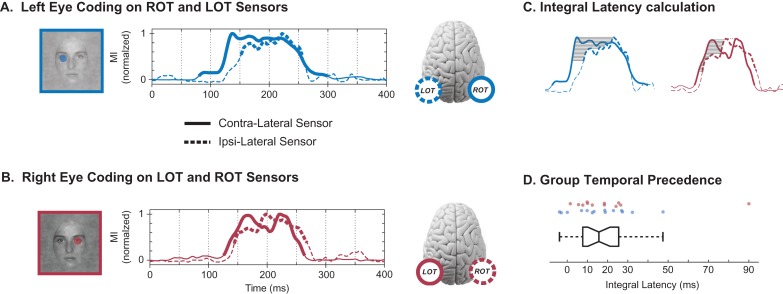
Figure 4.
Temporal precedence. (A) Left Eye Coding on ROT and LOT Sensors: The peak-normalized CMI curves indicate the initial coding of the left eye on the contralateral ROT sensor (plain curve) and the later coding of the same eye on the ipsilateral LOT sensor (dashed curve). Thicker sections of the MI curves represent statistical significance. (B) Right Eye Coding on LOT and ROT Sensors: The normalized MI curves indicate the initial coding of the right eye on the LOT sensor (plain curve) and the later coding of the same eye on the ROT sensor (dashed curve). Thicker sections of the MI curves represent statistical significance. (C) Integral Latency Calculation: We quantified temporal precedence with an integral latency measure. We normalized the CMI curves to their peak values (left eye, blue; right eye, red) and calculated the average delay between the CMI curves of the contralateral and ipsilateral sensors (solid, dashed lines respectively), over the y-axis region where both were significant (shaded region). (D) Group Temporal Precedence: Box plot of the integral latency (in ms) between contralateral and ispilateral coding of the same eye across hemispheric sensors. Positive values correspond to earlier contralateral coding. Each dot above represents a particular observer and eye feature—blue for left eye (ROT to LOT latency), red for right eye (LOT to ROT latency).

