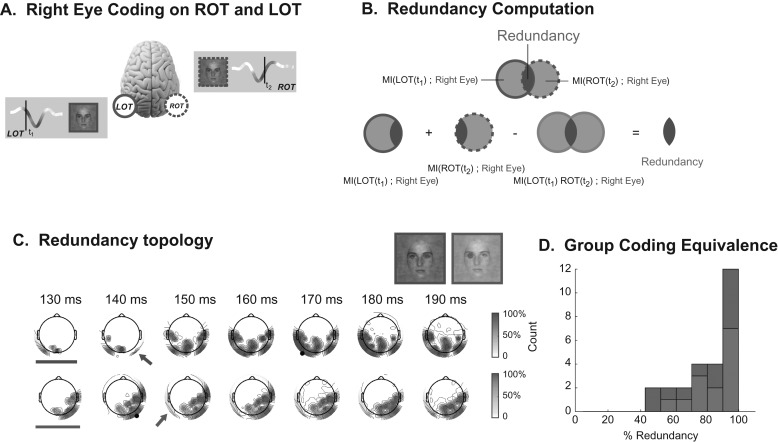
Figure 5.
Coding equivalence. (A) Illustration of the coding redundancy of the right eye between early LOT and late ROT: Coding redundancy of the right eye is computed between LOT and ROT at the peak of each MI curve (i.e., at t1 on LOT and t2 on ROT). (B) Redundancy Computation: Venn diagrams illustrate the computation of redundant (i.e., intersecting) eye information on LOT and ROT. (C) Redundancy Topography: Using as seed the peak MI time point on LOT (marked with black circle on red topographies), and ROT (black circle on blue topographies) the time courses of redundancy topographies illustrate when and where (see color-coded arrow) redundant ipsilateral coding of the eyes begins. Note that for both eyes, the 130 ms time point (indicated with bar) shows no ipsilateral redundancy. (D) Group Coding Equivalence: Left (in blue) and right (in red) eye coding redundancy between LOT and ROT, at the respective peaks of the MI curves, expressed as percentages.

