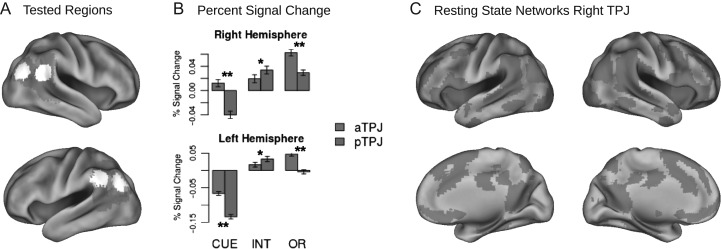
Figure 3.
Functional differentiation of subregions in TPJ. (A) White areas depict spheres in anterior TPJ and posterior TPJ around peak activations of reorienting contrast (red) and negative interaction contrast (green). These spheres were used to extract percent signal change (shown in B) and activation time courses for connectivity analysis (shown in C, only done for right TPJ). (B) Deactivation induced by orienting cues (CUE) and interaction of dual attentional demands (INT) were stronger in posterior compared to anterior TPJ, while stimulus-driven reorienting (OR) elicited stronger activations in anterior TPJ. (C) Resting state functional connectivity networks of anterior TPJ (red) and posterior TPJ (green) contrasted against each other.

