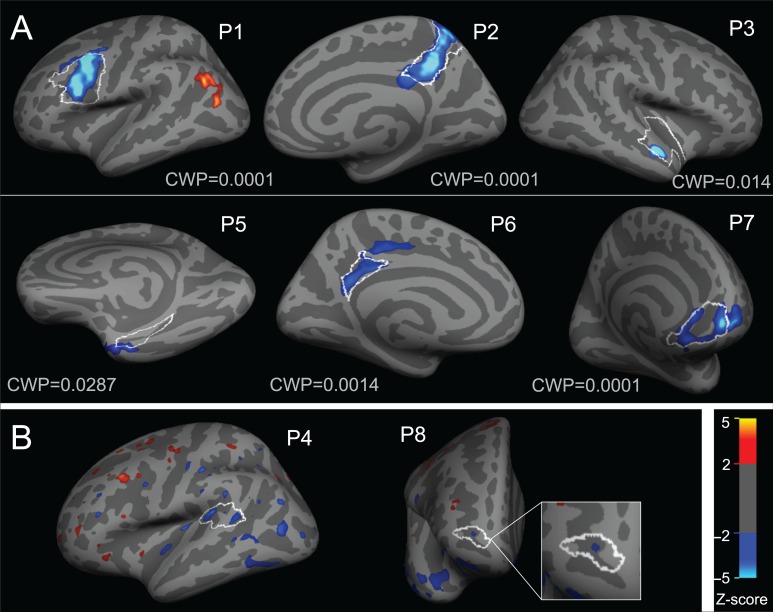
Figure 1.
Individual vertex-wise z-score maps showing reduced [11C]ABP688 BPND in FCD lesions. Results are displayed on each patient's inflated cortical surface, with light gray regions indicating gyri and dark regions indicating sulci. FCD boundaries from manual labeling are displayed as a white outline. Blue-teal colors indicate regions with lower BPND as compared to controls, whereas red-yellow colors indicate regions with higher BPND compared to controls. (A) Six patients showed clusters of decreased [11C]ABP688 BPND differences within the lesion boundaries, which remained significant after correction for multiple comparisons (corresponding cluster-wise P-value is indicated as CWP). (B) Two patients showed small lesional clusters of reduced [11C]ABP688 BPND that (displayed here at P < 0.05), were not significant after correction for multiple comparisons.

