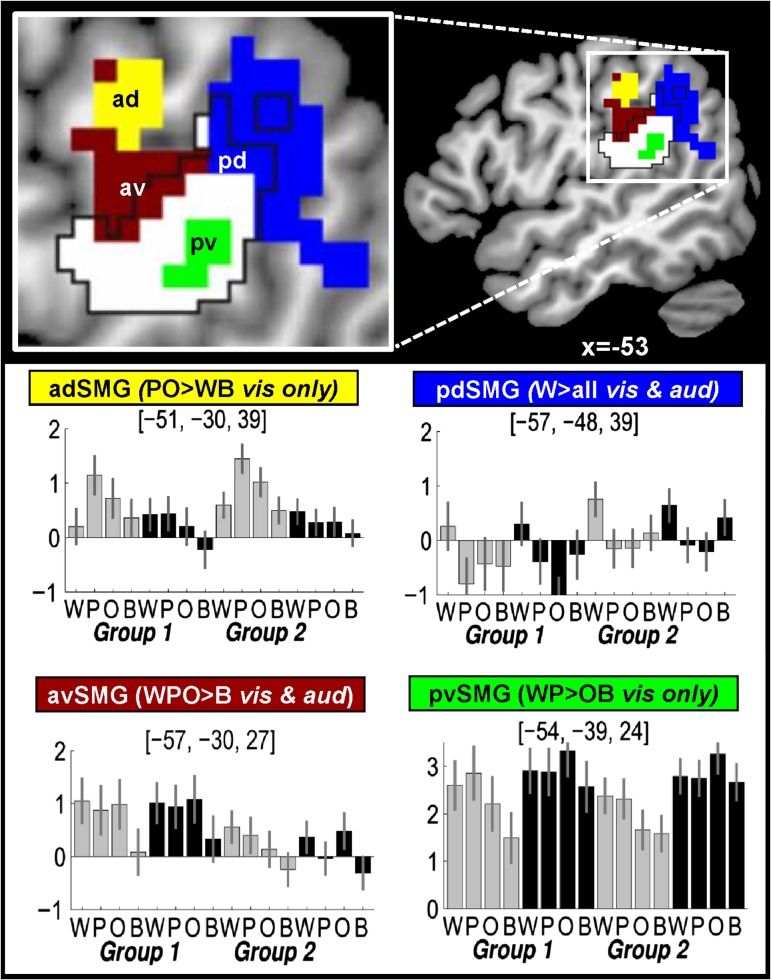
Figure 2.
Functional subdivisions within the SMG. Top row shows the left hemisphere activation clusters (yellow, blue, brown, and green) within the SMG for each effect of interest (see plots for anatomical region and condition effects). The white area (outlined in black) shows the borders of the SMG according to the IBASPM software (http://www.thomaskoenig.ch/Lester/ibaspm.htm) in SPM 12 but other studies (see Table 1) include more anterior areas, as shown in yellow. The peak coordinates for each effect are reported in Table 3. The extent of activation includes voxels that were significant at P < 0.001 for the main effect of interest, and inclusive/exclusive masking at P < 0.05 uncorrected. Plots show the relative activation (with 90% confidence intervals) across all 8 conditions for Group 1 and Group 2. Gray/black bars = visual/auditory tasks. See Table 5 for abbreviations and other peak coordinates.

