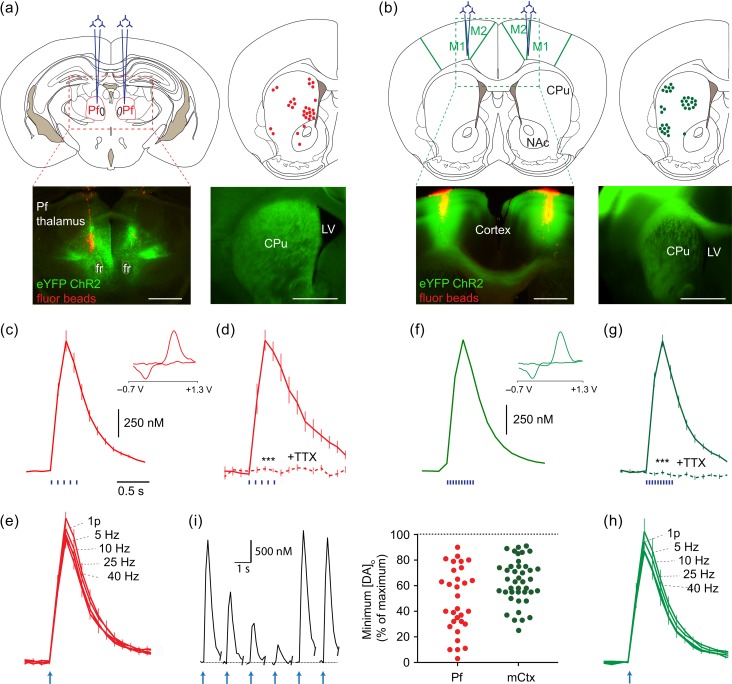
Figure 1.
Activation of thalamic or cortical afferents to striatum drives DA release. (a,b) Upper left, Typical bilateral injection sites of AAV-packaged ChR2 and lower left, red fluorescent marker beads and eYFP-tagged ChR2 targetted to (a) Pf intralaminar thalamus or (b) M1/M2 cortex (mCtx). Upper right, the distribution of DA release sites sampled throughout experiments. Lower right, example striatal ChR2-eYFP expression. Scale, 1 mm. (c–h) Mean striatal [DA]o ± SEM versus time after blue light stimulation of striatum from Pf- (c–e) or mCtx-injected mice (f–h). Insets, typical cyclic voltammograms show characteristic DA waveform. Stimuli (blue bars) and n values: (c) 400 ms train at 10 Hz, 23 recording sites in 11 mice; (d) 400 ms train at 10 Hz, 3 recording sites in 3 mice, TTX (1 µM, dashed line), data normalized to control; (e,h) 1 or 5p at 5–40 Hz (arrow indicates stimulation start), n = 3 mice, data normalized to 1p; (f) 400 ms train at 25 Hz, 30 recording sites in 17 mice; (g) 400 ms train at 25 Hz, n = 3 mice, TTX (1 µM, dashed line), data normalized to control. ***P < 0.001, Wilcoxon test. (i) Trial-by-trial reversible variability in evoked [DA]o at individual recording sites. Left, Example excerpt of recording at one recording site, 5p/10 Hz stimuli, Pf injected, scale bars are for the plots, plotted at 2.5 min intervals. Right, Scatter plot of reversible variation shows the lowest value detected expressed as a % of maximum value seen at that site (includes sites not used for further analysis).

