Figure 3.
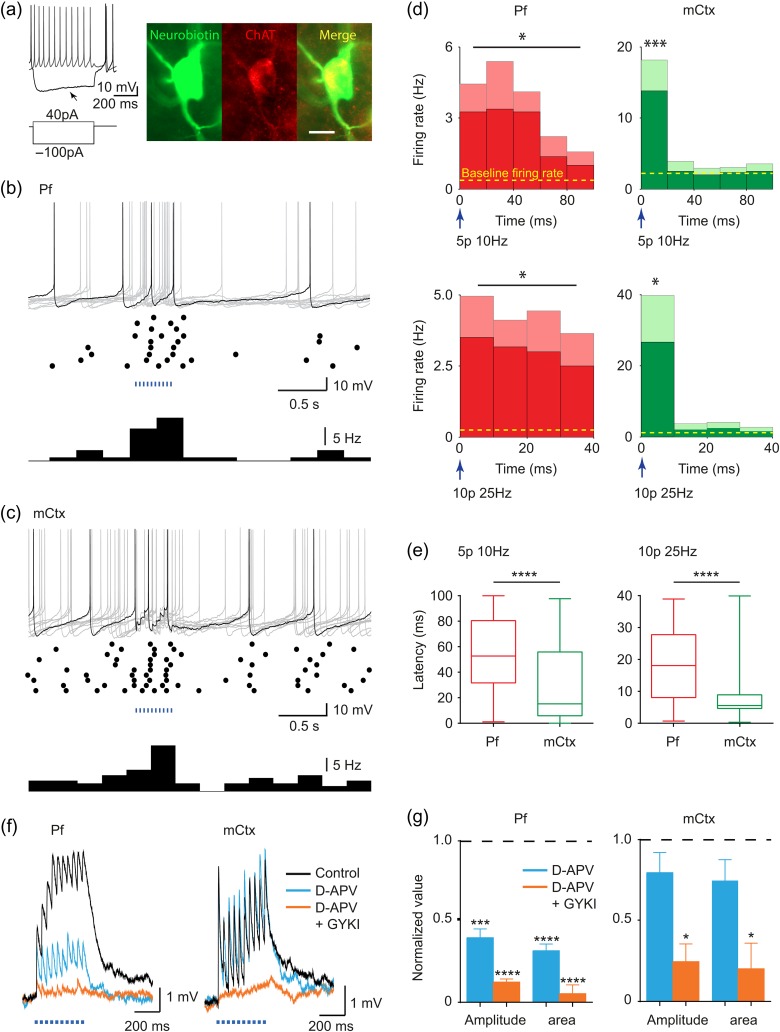
Cortical and thalamic striatal afferents drive ChI activity via ionotropic glutamate receptors. (a) Recorded cells show typical electrophysiological signature of ChIs with membrane potential sag (arrow) and co-label for neurobiotin fill (green) and ChAT (red). Anatomy scale bar, 20 µm. (b,c) Activity in ChIs following blue light-activation (400 ms train, 25 Hz) of (b) Pf or (c) mCtx afferents: top, example current clamp traces, 10 sweeps superimposed (gray), with 1 typical highlighted (black), middle, raster plot, 10 sweeps, bottom, histogram (bin size 0.25 s). (d) Mean spike frequency and SEM (mean, dark shading, and SEM, light shading) averaged following each light pulse in a train is significantly increased compared with mean baseline (dotted line, mean firing rate in the 3 s before stimulation), Pf (left, n = 4–6), mCtx (right, n = 6), 5 pulses 10 Hz (upper), 400 ms train at 25 Hz (lower). Mean baseline firing rates range from 0.252 to 2.21 Hz. Mean evoked activity corresponds to mean spike probabilities per stimulus ranging from 0.19 to 0.62. (e) Mean, 25% and 75% percentiles, and range of latencies to spike for 10 Hz (left) or 25 Hz (right) stimulation (400 ms train) of Pf (left) or mCtx (right) afferents. Latencies are significantly shorter for mCtx activation (Mann–Whitney test). (f) Example traces and (g) mean amplitude and area under the curve, of light-evoked EPSPs in ChIs in control conditions (black), in D-APV (50 µM, blue), then plus GYKI (10 µM, orange) after activation of Pf (left, n = 4–5) or mCtx afferents (right, n = 3–5). One-sample t-test versus control: *P < 0.05, **P < 0.01, ***P < 0.001, ****P < 0.0001.

