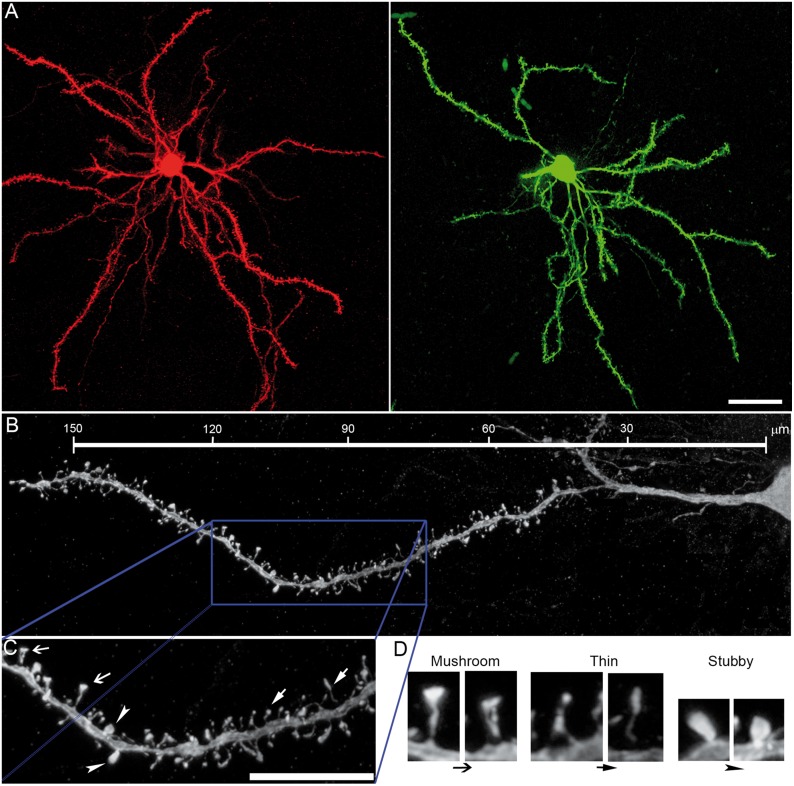
Figure 4.
3D morphometric analysis of types of spines in D1- and D2-MSNs. (A) Complete morphological reconstruction of D1-MSNs (red) and D2-MSNs (green). Scale bar = 25 µm. (B) Confocal image of a complete dendrite and high magnification (C) of a selected area in B (blue box) illustrating the types of spines quantified. Scale bar = 15 µm. (D) Higher magnification of spines indicated by arrows in C. Scale bar = 0.5 µm.

