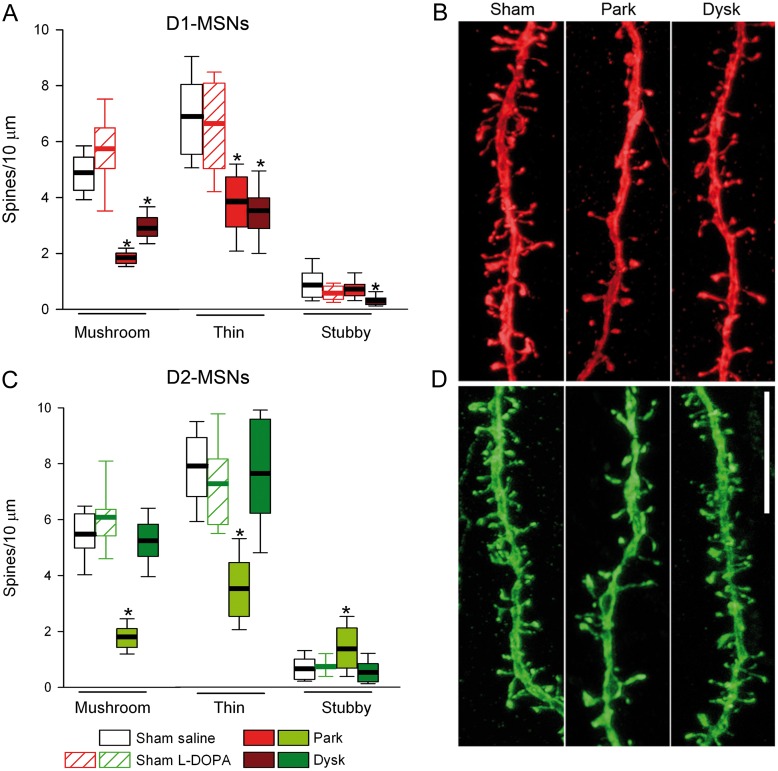
Figure 5.
Effects of DA depletion and L-DOPA treatment on the proportion of dendritic spine types in identified MSNs. (A) Number of mushroom, thin, and stubby spines per 10 µm in D1-MSN dendrites. (B) Representative confocal images of D1-MSN dendrites. (C) Quantification of the types of dendritic spines in D2-MSNs. (D) Illustrative confocal images of D2-MSNs; Scale bar 10 µm (*P < 0.05 vs. sham-lesioned; Kruskal–Wallis test).

