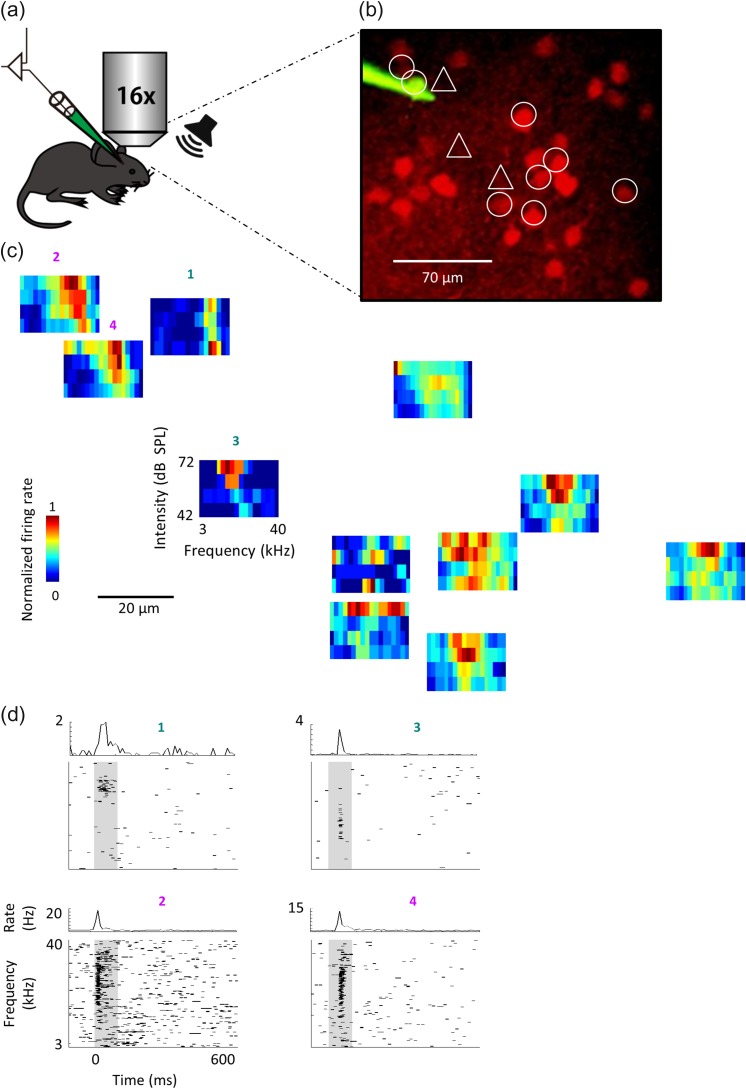
Figure 1.
Mapping local circuits with two photon targeted patch (TPTP). (a) Schematic representation of the experimental setup for TPTP. (b) Representative two-photon micrograph (projection image of 120 microns) of tdTomato+ cells (red) and the recording electrode (Alexa Fluor-488, green). The locations of the 12 recorded neurons are marked by circles (tdTomato+ cells) or triangles (tdTomato– cells). (c) FRAs of all recorded neurons. Each FRA is drawn at the location of the neuron from which it was derived. (d) Raster plots and peri-stimulus time histograms (PSTH) in response to pure tones of two representative PyrNs (top, cells #1,3) and two representative PVNs (bottom, cells #2,4) from the circuit shown in c. Gray bars indicate the time of stimulus presentation (100 ms).

