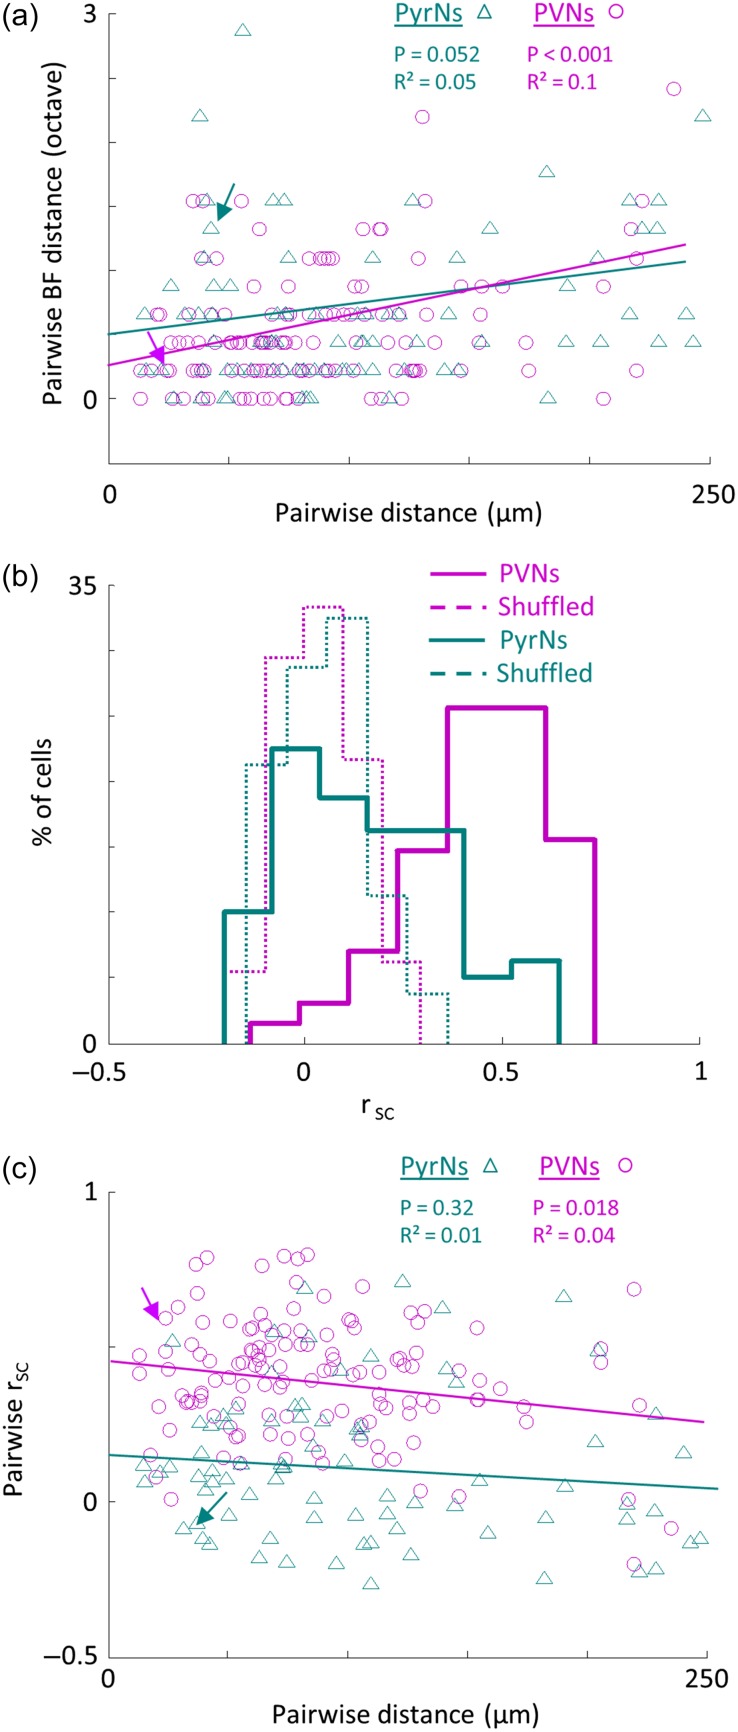
Figure 2.
Distinct functional organization of PVNs and PyrNs. (a) Pairwise difference in BF as a function of spatial distance between pairs of PyrNs (green triangles; n = 80 pairs) and PVNs (magenta circles; n = 129 pairs). Lines indicate the best linear fit. Arrows mark the two pairs shown in Figure 1d. (b) Distribution histograms of pairwise signal correlations (rsc) values between all pairs in the dataset of PyrNs (green solid line; 0.12 ± 0.24) and PVNs (magenta solid line; 0.4 ± 0.19). PyrNs and PVNs distributions are significantly different (Mann–Whitney U-test: P < 0.001). Distributions for shuffled FRAs are centered around zero and are not different between groups (dashed lines). (c) Pairwise rsc as a function of the spatial distance between the pair. Same pairs as in a. PVNs but not PyrNs show a significant decrease with distance (PVNs: R² = 0.04, P = 0.018; PyrNs: R² = 0.01, P = 0.32).

