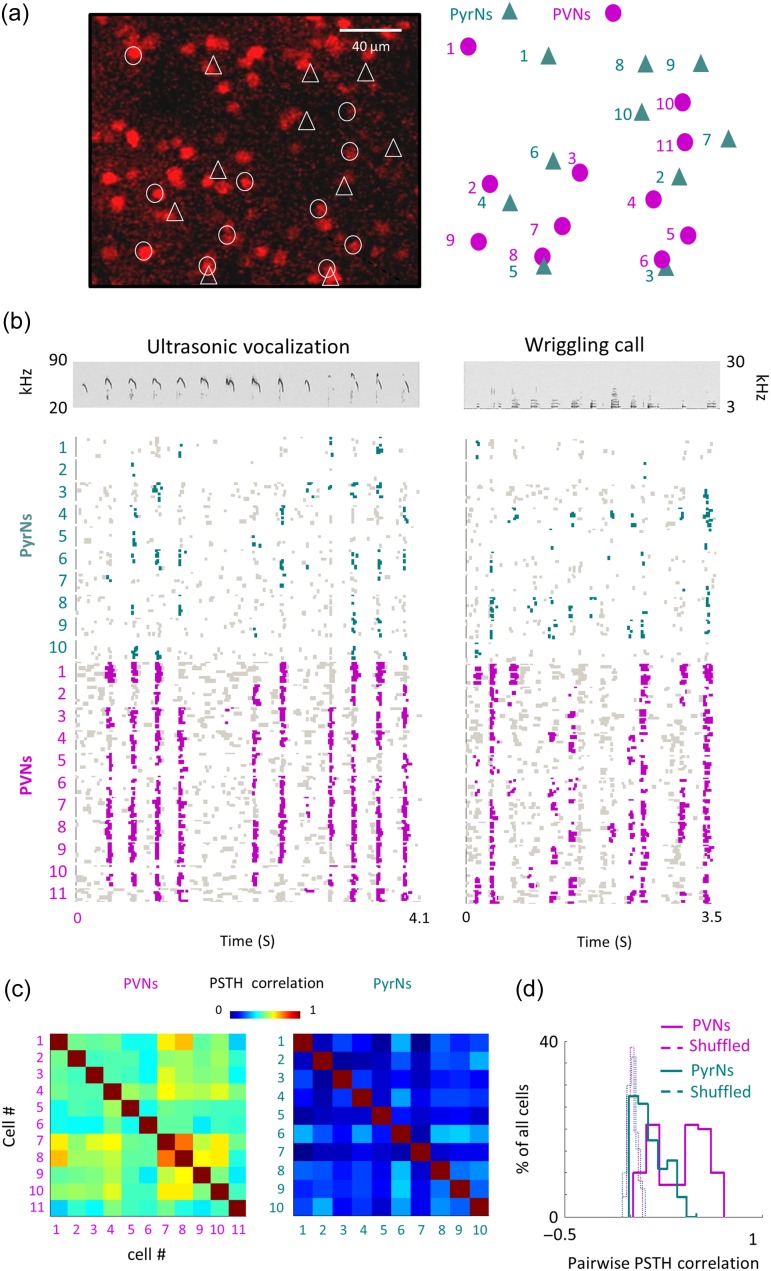
Figure 4.
A representative local circuit and its responses to natural calls. (a) Left, two-photon micrograph (projection image of 245 microns) of tdTomato+ cells (red) from one representative penetration site. All recorded neurons are labeled in either circles (tdTomato+ cells) or triangles (tdTomato– cells). Right, schematic representation of the location of neurons recorded in this site. (b) Top, spectrograms of the ultra-sonic vocalization (USV; left) and wriggling call (WC; right). Bottom, Raster plots of all 21 neurons (10 PyrNs and 11 PVNs) recorded from the representative circuit shown in a in response to the natural calls. Only responses to calls at 73 dB SPL are shown. Green and magenta dots correspond to spikes that are statistically above the baseline rate (see Methods). (c) Pairwise PSTH correlations among neighboring PVNs (Left) and PyrNs (Right) from the circuit shown in a, b. (d) Distribution histograms of PSTH correlations values between all pairs in the dataset that were recorded from the same mice. rsc distributions of PyrNs (green solid line; 0.11 ± 0.12) and PVNs (magenta solid line; 0.34 ± 0.2) are significantly different (Mann–Whitney U-test: ***P < 0.001). Distributions for shuffled FRAs are centered around zero and are not different between groups (dashed lines).

