Figure 5.
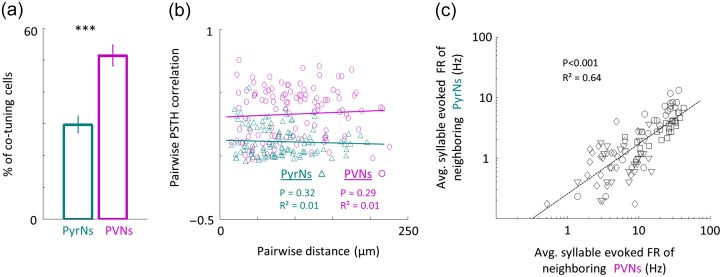
Distinct functional organization in responses to natural stimuli. (a) Percent of neighboring PryNs (green bar) and PVNs (magenta bar) which evoked significant responses to a specific syllable (mean±SEM. Man–Whitney U-test; *** P < 0.001). (b) Pairwise PSTH correlation values as a function of pairwise distance between PyrNs (green triangles) and PVNs (magenta circles). Lines indicate the best linear fit (PyrNs: R² = 0.01, P = 0.32; PVNs: R² = 0.01, P = 0.29). (c) Scatter plot showing linear dependency of average syllable evoked firing rate of neighboring PyrNs and its PVN neighbors (<250 microns of each other). Each marker corresponds to the average circuit response for one syllable in the sentence. The “average syllable FR” was computed for each syllable as the average firing rate across all the local cells recorded. Therefore, for each mouse there are 26 markers representing the 26 syllables. Different markers correspond to different mice. Neurons shown in Figure 4 are represented as squares. Lines indicate the best linear fit (R² = 0.64, P < 0.001).

