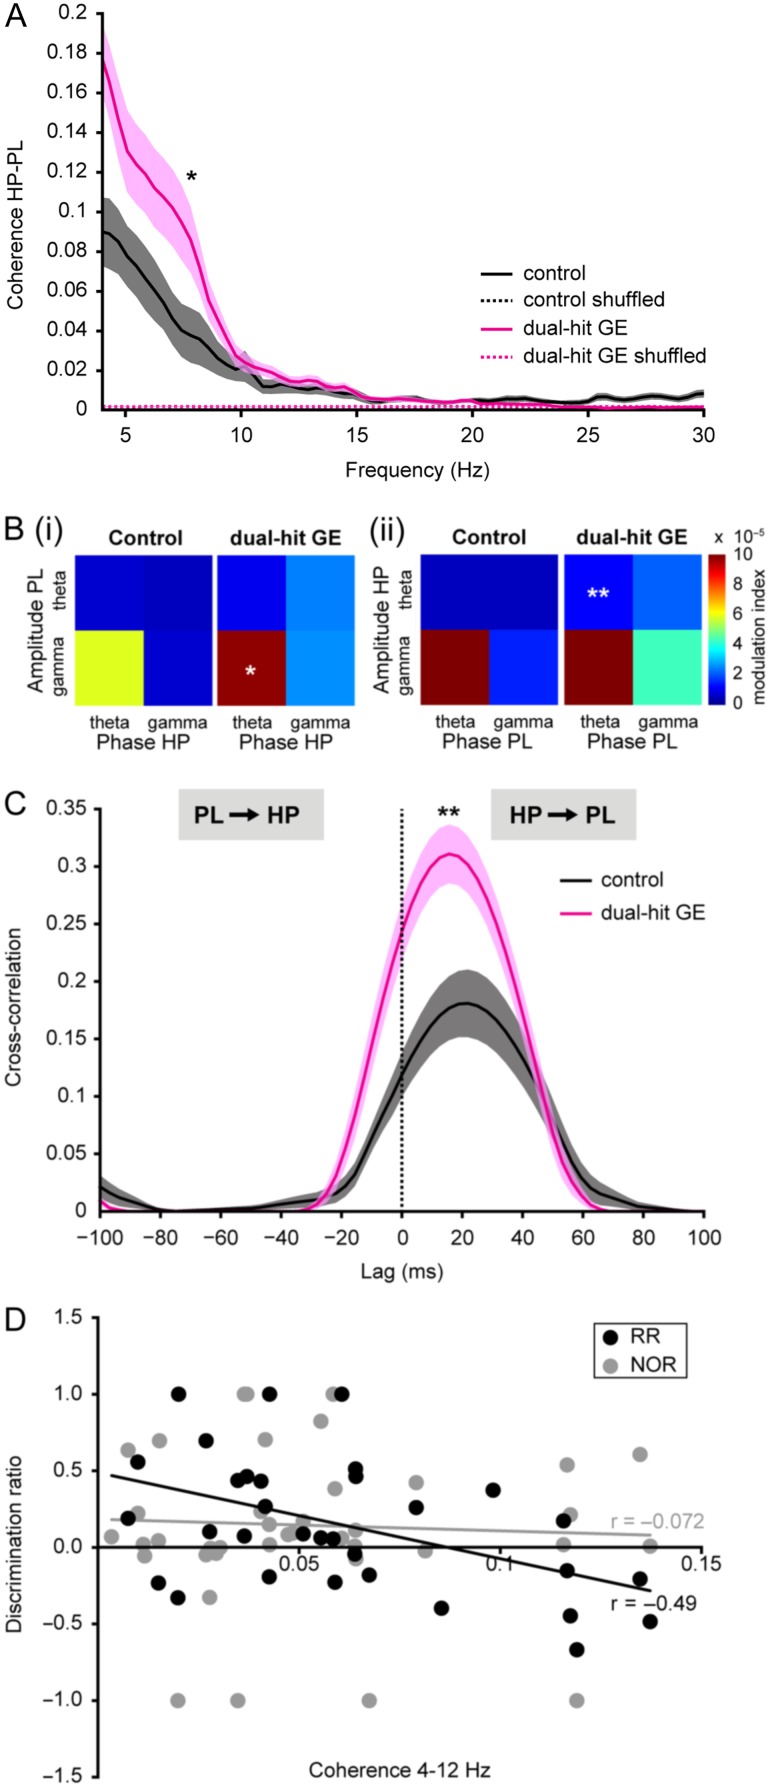
Figure 3.
Hyper-coupling by synchrony and directed interactions within hippocampal–prelimbic networks of pre-juvenile dual-hit GE mice. (A) Averaged coherence spectra for simultaneously occurring oscillations in HP and PL of control (n = 12, black) and dual-hit GE mice (n = 11, magenta) for original (straight line) and time-shuffled (dotted line) data. (B) (i) Color-coded plots displaying the mean MI for the CFC of oscillation amplitudes in PL to the hippocampal phase in control (n = 12, left) and dual-hit GE (n = 11, right) mice. (ii) Same as (i) for CFC of amplitudes in the HP to the prelimbic phase. (C) Cross-correlations of the amplitudes of theta-filtered LFP recorded from PL and HP averaged for all investigated control (n = 12, black) and dual-hit GE mice (n = 11, magenta). Positive time lags correspond to HP leading the PL. (D) Diagram displaying the relationship between hippocampal–prefrontal coherence and behavioral performance in NOR (n = 40, gray) and RR task (n = 32, black) assessed as discrimination ratio between the two objects (i.e. difference between the time with novel object and the time with familiar object divided by total time of object exploration). The regression lines are plotted in the corresponding colors (black for RR, gray for NOR). In (A) and (C), the transparent areas correspond to s.e.m. *P < 0.05 and **P < 0.01.

